Immigrants from Switzerland vs Immigrants from Croatia GED/Equivalency
COMPARE
Immigrants from Switzerland
Immigrants from Croatia
GED/Equivalency
GED/Equivalency Comparison
Immigrants from Switzerland
Immigrants from Croatia
88.1%
GED/EQUIVALENCY
99.5/ 100
METRIC RATING
46th/ 347
METRIC RANK
87.3%
GED/EQUIVALENCY
96.9/ 100
METRIC RATING
98th/ 347
METRIC RANK
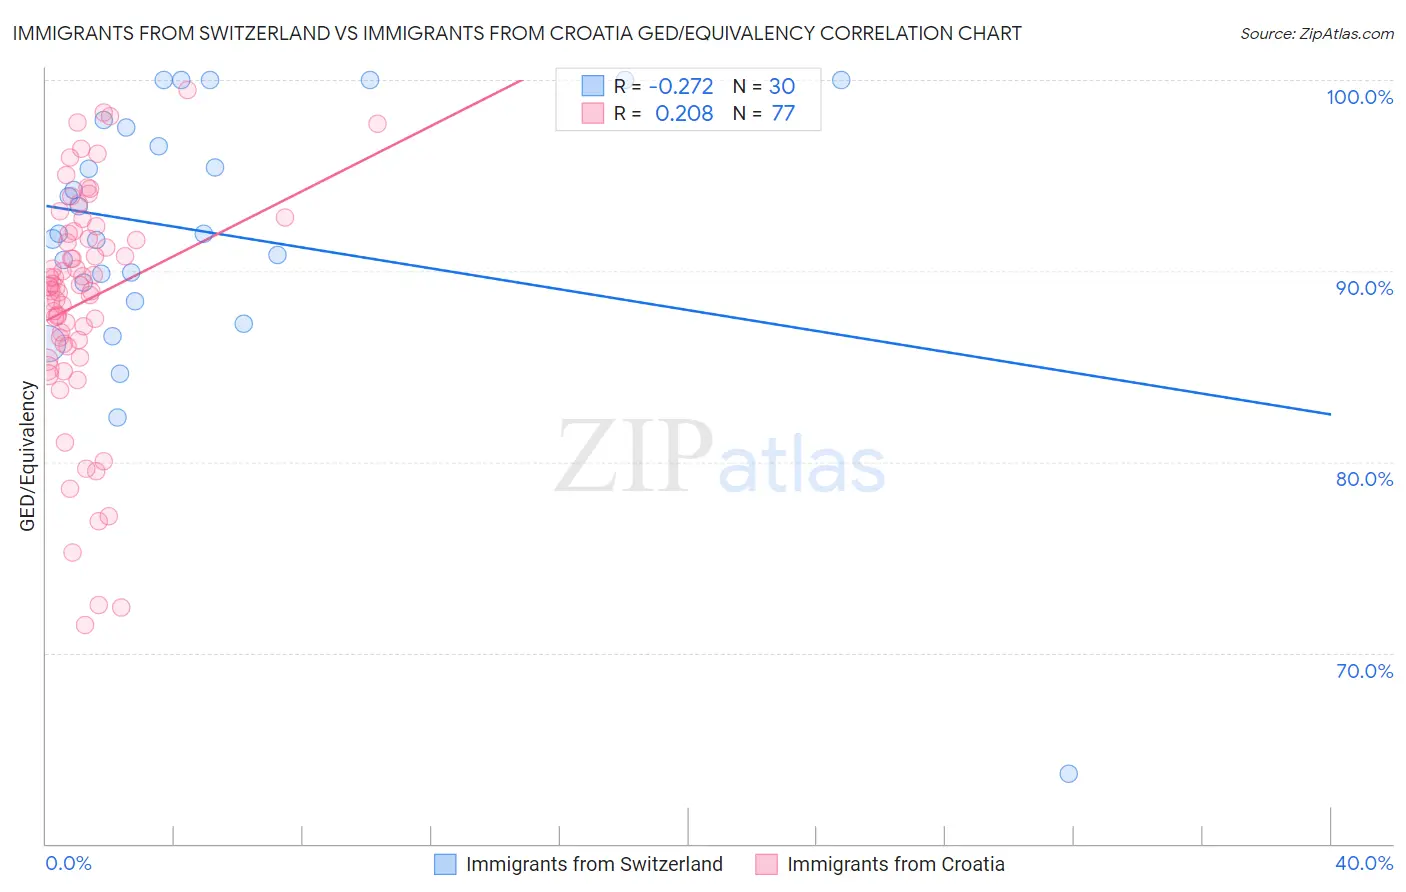
Immigrants from Switzerland vs Immigrants from Croatia GED/Equivalency Correlation Chart
The statistical analysis conducted on geographies consisting of 148,083,583 people shows a weak negative correlation between the proportion of Immigrants from Switzerland and percentage of population with at least ged/equivalency education in the United States with a correlation coefficient (R) of -0.272 and weighted average of 88.1%. Similarly, the statistical analysis conducted on geographies consisting of 132,577,989 people shows a weak positive correlation between the proportion of Immigrants from Croatia and percentage of population with at least ged/equivalency education in the United States with a correlation coefficient (R) of 0.208 and weighted average of 87.3%, a difference of 0.93%.
GED/Equivalency Correlation Summary
| Measurement | Immigrants from Switzerland | Immigrants from Croatia |
| Minimum | 63.6% | 71.5% |
| Maximum | 100.0% | 99.5% |
| Range | 36.4% | 28.0% |
| Mean | 92.0% | 88.4% |
| Median | 92.0% | 89.2% |
| Interquartile 25% (IQ1) | 89.4% | 86.1% |
| Interquartile 75% (IQ3) | 97.5% | 92.0% |
| Interquartile Range (IQR) | 8.2% | 5.9% |
| Standard Deviation (Sample) | 7.4% | 6.0% |
| Standard Deviation (Population) | 7.2% | 6.0% |
Similar Demographics by GED/Equivalency
Demographics Similar to Immigrants from Switzerland by GED/Equivalency
In terms of ged/equivalency, the demographic groups most similar to Immigrants from Switzerland are Immigrants from Latvia (88.1%, a difference of 0.010%), Czech (88.1%, a difference of 0.020%), Greek (88.1%, a difference of 0.020%), Australian (88.1%, a difference of 0.030%), and Immigrants from Korea (88.1%, a difference of 0.040%).
| Demographics | Rating | Rank | GED/Equivalency |
| Immigrants | Israel | 99.6 /100 | #39 | Exceptional 88.2% |
| Italians | 99.6 /100 | #40 | Exceptional 88.2% |
| Finns | 99.6 /100 | #41 | Exceptional 88.2% |
| Cambodians | 99.6 /100 | #42 | Exceptional 88.2% |
| Immigrants | Scotland | 99.6 /100 | #43 | Exceptional 88.2% |
| Macedonians | 99.5 /100 | #44 | Exceptional 88.1% |
| Czechs | 99.5 /100 | #45 | Exceptional 88.1% |
| Immigrants | Switzerland | 99.5 /100 | #46 | Exceptional 88.1% |
| Immigrants | Latvia | 99.5 /100 | #47 | Exceptional 88.1% |
| Greeks | 99.5 /100 | #48 | Exceptional 88.1% |
| Australians | 99.5 /100 | #49 | Exceptional 88.1% |
| Immigrants | Korea | 99.5 /100 | #50 | Exceptional 88.1% |
| Immigrants | Netherlands | 99.4 /100 | #51 | Exceptional 88.0% |
| Zimbabweans | 99.4 /100 | #52 | Exceptional 88.0% |
| Immigrants | South Africa | 99.4 /100 | #53 | Exceptional 88.0% |
Demographics Similar to Immigrants from Croatia by GED/Equivalency
In terms of ged/equivalency, the demographic groups most similar to Immigrants from Croatia are Immigrants from Belarus (87.3%, a difference of 0.010%), Palestinian (87.3%, a difference of 0.030%), Syrian (87.2%, a difference of 0.060%), Immigrants from Western Europe (87.3%, a difference of 0.070%), and Lebanese (87.2%, a difference of 0.11%).
| Demographics | Rating | Rank | GED/Equivalency |
| Immigrants | Eastern Asia | 97.9 /100 | #91 | Exceptional 87.4% |
| Israelis | 97.8 /100 | #92 | Exceptional 87.4% |
| Immigrants | North Macedonia | 97.8 /100 | #93 | Exceptional 87.4% |
| Immigrants | Russia | 97.8 /100 | #94 | Exceptional 87.4% |
| Immigrants | Greece | 97.7 /100 | #95 | Exceptional 87.4% |
| Czechoslovakians | 97.6 /100 | #96 | Exceptional 87.4% |
| Immigrants | Western Europe | 97.3 /100 | #97 | Exceptional 87.3% |
| Immigrants | Croatia | 96.9 /100 | #98 | Exceptional 87.3% |
| Immigrants | Belarus | 96.9 /100 | #99 | Exceptional 87.3% |
| Palestinians | 96.8 /100 | #100 | Exceptional 87.3% |
| Syrians | 96.6 /100 | #101 | Exceptional 87.2% |
| Lebanese | 96.2 /100 | #102 | Exceptional 87.2% |
| Jordanians | 96.1 /100 | #103 | Exceptional 87.2% |
| Immigrants | Hungary | 96.0 /100 | #104 | Exceptional 87.2% |
| Indians (Asian) | 95.9 /100 | #105 | Exceptional 87.1% |