Hungarian vs Immigrants from Croatia 3 or more Vehicles in Household
COMPARE
Hungarian
Immigrants from Croatia
3 or more Vehicles in Household
3 or more Vehicles in Household Comparison
Hungarians
Immigrants from Croatia
19.8%
3 OR MORE VEHICLES IN HOUSEHOLD
70.5/ 100
METRIC RATING
157th/ 347
METRIC RANK
17.2%
3 OR MORE VEHICLES IN HOUSEHOLD
0.2/ 100
METRIC RATING
285th/ 347
METRIC RANK
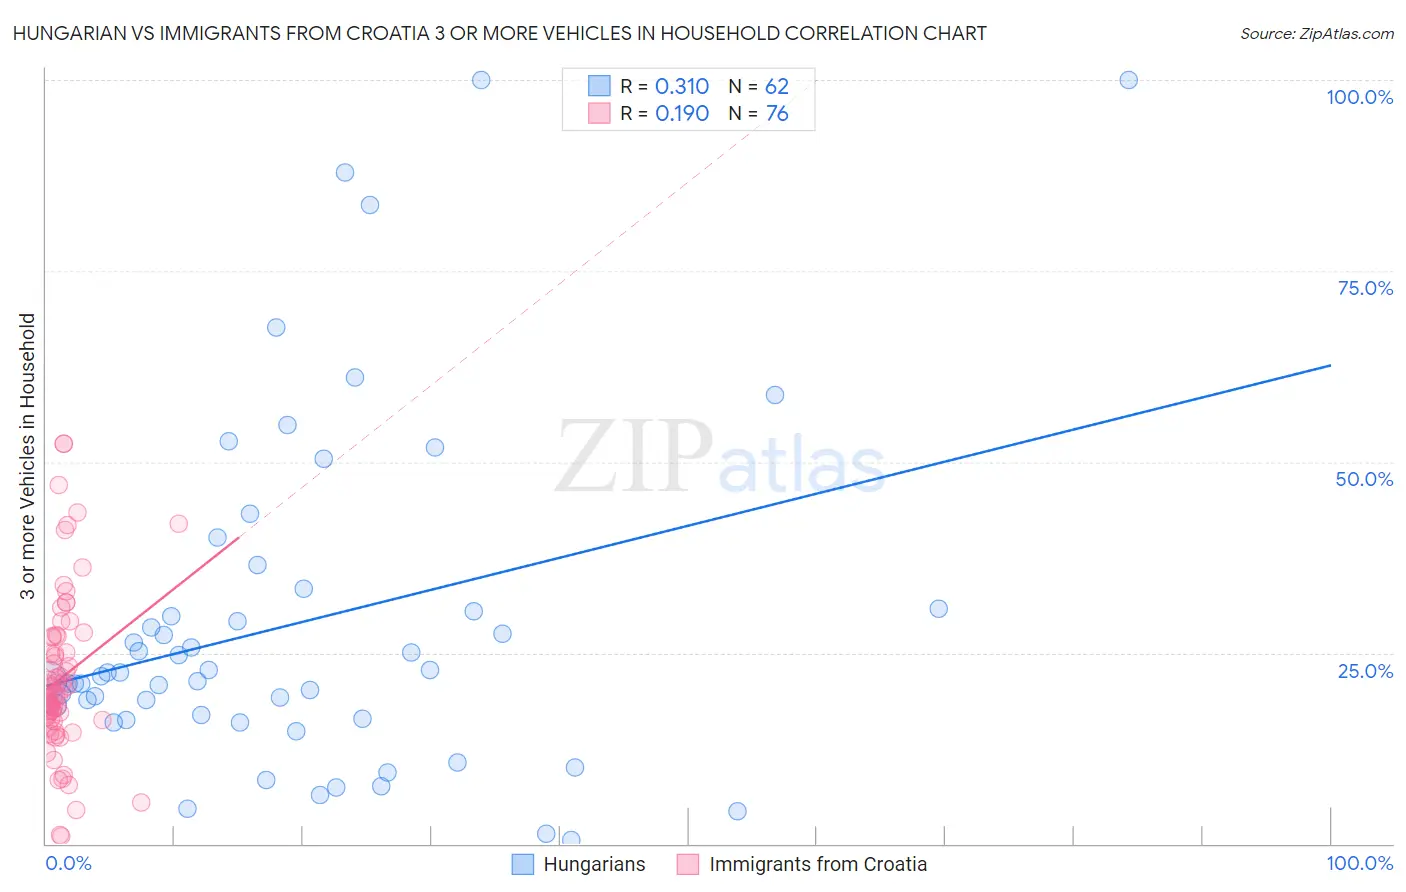
Hungarian vs Immigrants from Croatia 3 or more Vehicles in Household Correlation Chart
The statistical analysis conducted on geographies consisting of 485,698,849 people shows a mild positive correlation between the proportion of Hungarians and percentage of households with 3 or more vehicles available in the United States with a correlation coefficient (R) of 0.310 and weighted average of 19.8%. Similarly, the statistical analysis conducted on geographies consisting of 132,550,126 people shows a poor positive correlation between the proportion of Immigrants from Croatia and percentage of households with 3 or more vehicles available in the United States with a correlation coefficient (R) of 0.190 and weighted average of 17.2%, a difference of 15.3%.
3 or more Vehicles in Household Correlation Summary
| Measurement | Hungarian | Immigrants from Croatia |
| Minimum | 0.54% | 0.97% |
| Maximum | 100.0% | 52.4% |
| Range | 99.5% | 51.4% |
| Mean | 28.9% | 21.7% |
| Median | 22.2% | 19.3% |
| Interquartile 25% (IQ1) | 16.4% | 16.4% |
| Interquartile 75% (IQ3) | 30.8% | 27.1% |
| Interquartile Range (IQR) | 14.4% | 10.7% |
| Standard Deviation (Sample) | 22.4% | 10.5% |
| Standard Deviation (Population) | 22.2% | 10.5% |
Similar Demographics by 3 or more Vehicles in Household
Demographics Similar to Hungarians by 3 or more Vehicles in Household
In terms of 3 or more vehicles in household, the demographic groups most similar to Hungarians are Thai (19.8%, a difference of 0.050%), Armenian (19.8%, a difference of 0.15%), Immigrants from Pakistan (19.8%, a difference of 0.21%), Tlingit-Haida (19.9%, a difference of 0.26%), and Immigrants from Lebanon (19.8%, a difference of 0.26%).
| Demographics | Rating | Rank | 3 or more Vehicles in Household |
| Immigrants | Immigrants | 80.8 /100 | #150 | Excellent 20.0% |
| Taiwanese | 80.6 /100 | #151 | Excellent 20.0% |
| Lebanese | 79.8 /100 | #152 | Good 20.0% |
| Yuman | 75.6 /100 | #153 | Good 19.9% |
| Immigrants | Jordan | 75.0 /100 | #154 | Good 19.9% |
| Tlingit-Haida | 73.4 /100 | #155 | Good 19.9% |
| Thais | 71.1 /100 | #156 | Good 19.8% |
| Hungarians | 70.5 /100 | #157 | Good 19.8% |
| Armenians | 68.8 /100 | #158 | Good 19.8% |
| Immigrants | Pakistan | 68.2 /100 | #159 | Good 19.8% |
| Immigrants | Lebanon | 67.6 /100 | #160 | Good 19.8% |
| Immigrants | Guatemala | 65.6 /100 | #161 | Good 19.7% |
| Estonians | 63.2 /100 | #162 | Good 19.7% |
| Chileans | 63.0 /100 | #163 | Good 19.7% |
| Yugoslavians | 62.9 /100 | #164 | Good 19.7% |
Demographics Similar to Immigrants from Croatia by 3 or more Vehicles in Household
In terms of 3 or more vehicles in household, the demographic groups most similar to Immigrants from Croatia are Menominee (17.2%, a difference of 0.060%), Immigrants from Brazil (17.1%, a difference of 0.36%), Immigrants from Uruguay (17.1%, a difference of 0.45%), Immigrants from Liberia (17.1%, a difference of 0.52%), and Immigrants from Colombia (17.3%, a difference of 0.73%).
| Demographics | Rating | Rank | 3 or more Vehicles in Household |
| Immigrants | Bahamas | 0.3 /100 | #278 | Tragic 17.4% |
| Immigrants | Kazakhstan | 0.3 /100 | #279 | Tragic 17.4% |
| Immigrants | Eastern Europe | 0.3 /100 | #280 | Tragic 17.4% |
| Immigrants | Latvia | 0.3 /100 | #281 | Tragic 17.4% |
| Immigrants | Ireland | 0.3 /100 | #282 | Tragic 17.3% |
| Blacks/African Americans | 0.3 /100 | #283 | Tragic 17.3% |
| Immigrants | Colombia | 0.3 /100 | #284 | Tragic 17.3% |
| Immigrants | Croatia | 0.2 /100 | #285 | Tragic 17.2% |
| Menominee | 0.2 /100 | #286 | Tragic 17.2% |
| Immigrants | Brazil | 0.2 /100 | #287 | Tragic 17.1% |
| Immigrants | Uruguay | 0.2 /100 | #288 | Tragic 17.1% |
| Immigrants | Liberia | 0.1 /100 | #289 | Tragic 17.1% |
| Liberians | 0.1 /100 | #290 | Tragic 17.0% |
| Immigrants | Congo | 0.1 /100 | #291 | Tragic 17.0% |
| Immigrants | Spain | 0.1 /100 | #292 | Tragic 17.0% |