Pima vs Immigrants from Croatia 3 or more Vehicles in Household
COMPARE
Pima
Immigrants from Croatia
3 or more Vehicles in Household
3 or more Vehicles in Household Comparison
Pima
Immigrants from Croatia
22.0%
3 OR MORE VEHICLES IN HOUSEHOLD
99.9/ 100
METRIC RATING
65th/ 347
METRIC RANK
17.2%
3 OR MORE VEHICLES IN HOUSEHOLD
0.2/ 100
METRIC RATING
285th/ 347
METRIC RANK
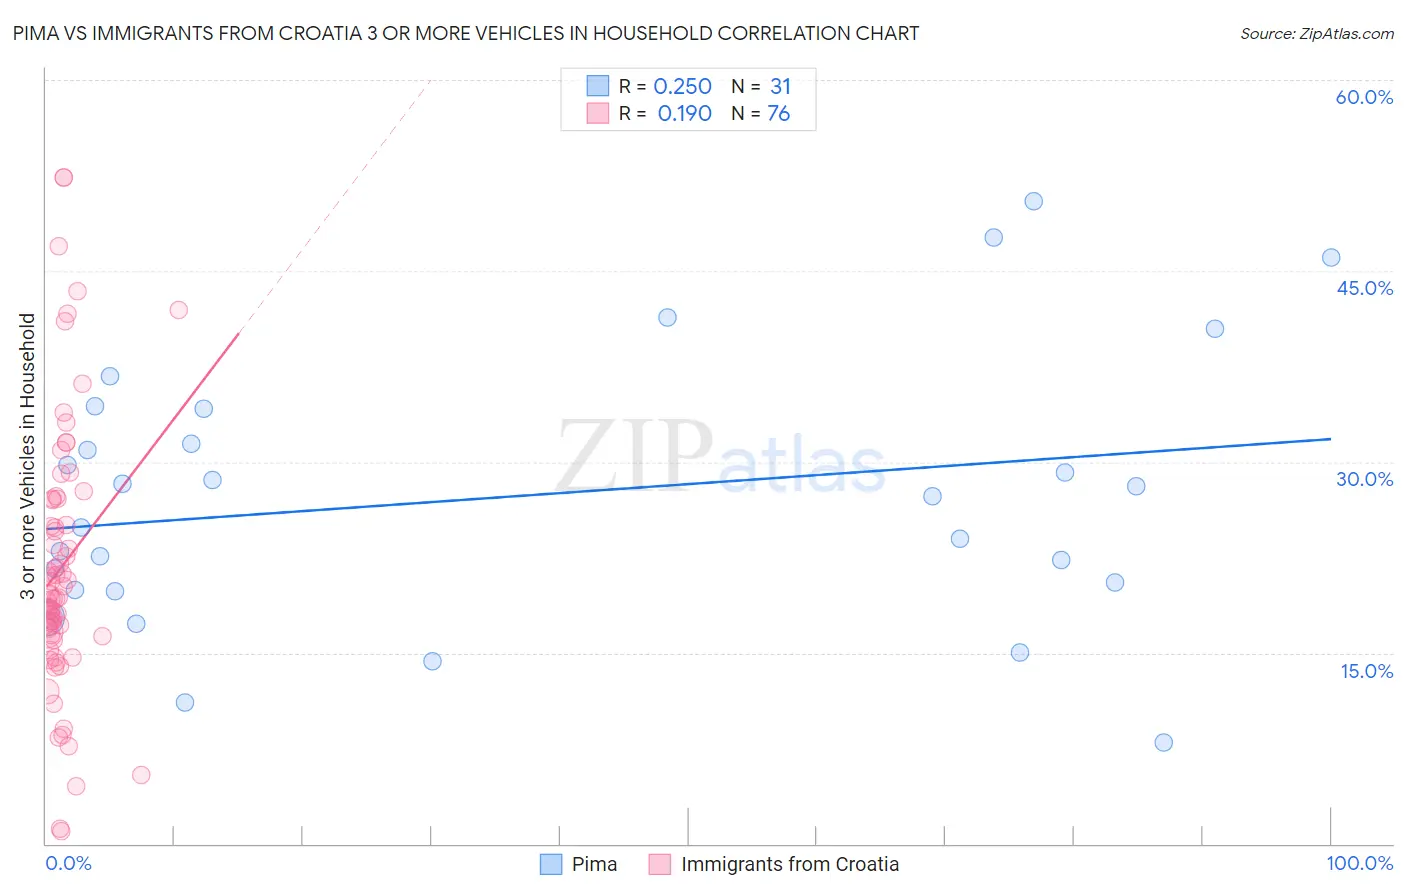
Pima vs Immigrants from Croatia 3 or more Vehicles in Household Correlation Chart
The statistical analysis conducted on geographies consisting of 61,538,722 people shows a weak positive correlation between the proportion of Pima and percentage of households with 3 or more vehicles available in the United States with a correlation coefficient (R) of 0.250 and weighted average of 22.0%. Similarly, the statistical analysis conducted on geographies consisting of 132,550,126 people shows a poor positive correlation between the proportion of Immigrants from Croatia and percentage of households with 3 or more vehicles available in the United States with a correlation coefficient (R) of 0.190 and weighted average of 17.2%, a difference of 28.2%.
3 or more Vehicles in Household Correlation Summary
| Measurement | Pima | Immigrants from Croatia |
| Minimum | 8.0% | 0.97% |
| Maximum | 50.5% | 52.4% |
| Range | 42.6% | 51.4% |
| Mean | 27.3% | 21.7% |
| Median | 27.3% | 19.3% |
| Interquartile 25% (IQ1) | 20.0% | 16.4% |
| Interquartile 75% (IQ3) | 34.1% | 27.1% |
| Interquartile Range (IQR) | 14.2% | 10.7% |
| Standard Deviation (Sample) | 10.5% | 10.5% |
| Standard Deviation (Population) | 10.3% | 10.5% |
Similar Demographics by 3 or more Vehicles in Household
Demographics Similar to Pima by 3 or more Vehicles in Household
In terms of 3 or more vehicles in household, the demographic groups most similar to Pima are Northern European (22.0%, a difference of 0.14%), Alaskan Athabascan (21.9%, a difference of 0.40%), Immigrants from Taiwan (22.1%, a difference of 0.42%), British (21.9%, a difference of 0.55%), and Creek (21.9%, a difference of 0.58%).
| Demographics | Rating | Rank | 3 or more Vehicles in Household |
| Spaniards | 100.0 /100 | #58 | Exceptional 22.3% |
| Navajo | 100.0 /100 | #59 | Exceptional 22.3% |
| Finns | 99.9 /100 | #60 | Exceptional 22.3% |
| Bhutanese | 99.9 /100 | #61 | Exceptional 22.2% |
| Fijians | 99.9 /100 | #62 | Exceptional 22.2% |
| Chickasaw | 99.9 /100 | #63 | Exceptional 22.2% |
| Immigrants | Taiwan | 99.9 /100 | #64 | Exceptional 22.1% |
| Pima | 99.9 /100 | #65 | Exceptional 22.0% |
| Northern Europeans | 99.9 /100 | #66 | Exceptional 22.0% |
| Alaskan Athabascans | 99.9 /100 | #67 | Exceptional 21.9% |
| British | 99.9 /100 | #68 | Exceptional 21.9% |
| Creek | 99.9 /100 | #69 | Exceptional 21.9% |
| Bangladeshis | 99.8 /100 | #70 | Exceptional 21.9% |
| Potawatomi | 99.8 /100 | #71 | Exceptional 21.9% |
| Portuguese | 99.8 /100 | #72 | Exceptional 21.8% |
Demographics Similar to Immigrants from Croatia by 3 or more Vehicles in Household
In terms of 3 or more vehicles in household, the demographic groups most similar to Immigrants from Croatia are Menominee (17.2%, a difference of 0.060%), Immigrants from Brazil (17.1%, a difference of 0.36%), Immigrants from Uruguay (17.1%, a difference of 0.45%), Immigrants from Liberia (17.1%, a difference of 0.52%), and Immigrants from Colombia (17.3%, a difference of 0.73%).
| Demographics | Rating | Rank | 3 or more Vehicles in Household |
| Immigrants | Bahamas | 0.3 /100 | #278 | Tragic 17.4% |
| Immigrants | Kazakhstan | 0.3 /100 | #279 | Tragic 17.4% |
| Immigrants | Eastern Europe | 0.3 /100 | #280 | Tragic 17.4% |
| Immigrants | Latvia | 0.3 /100 | #281 | Tragic 17.4% |
| Immigrants | Ireland | 0.3 /100 | #282 | Tragic 17.3% |
| Blacks/African Americans | 0.3 /100 | #283 | Tragic 17.3% |
| Immigrants | Colombia | 0.3 /100 | #284 | Tragic 17.3% |
| Immigrants | Croatia | 0.2 /100 | #285 | Tragic 17.2% |
| Menominee | 0.2 /100 | #286 | Tragic 17.2% |
| Immigrants | Brazil | 0.2 /100 | #287 | Tragic 17.1% |
| Immigrants | Uruguay | 0.2 /100 | #288 | Tragic 17.1% |
| Immigrants | Liberia | 0.1 /100 | #289 | Tragic 17.1% |
| Liberians | 0.1 /100 | #290 | Tragic 17.0% |
| Immigrants | Congo | 0.1 /100 | #291 | Tragic 17.0% |
| Immigrants | Spain | 0.1 /100 | #292 | Tragic 17.0% |