Immigrants from Switzerland vs Immigrants from Croatia Median Female Earnings
COMPARE
Immigrants from Switzerland
Immigrants from Croatia
Median Female Earnings
Median Female Earnings Comparison
Immigrants from Switzerland
Immigrants from Croatia
$43,996
MEDIAN FEMALE EARNINGS
100.0/ 100
METRIC RATING
37th/ 347
METRIC RANK
$43,258
MEDIAN FEMALE EARNINGS
99.9/ 100
METRIC RATING
56th/ 347
METRIC RANK
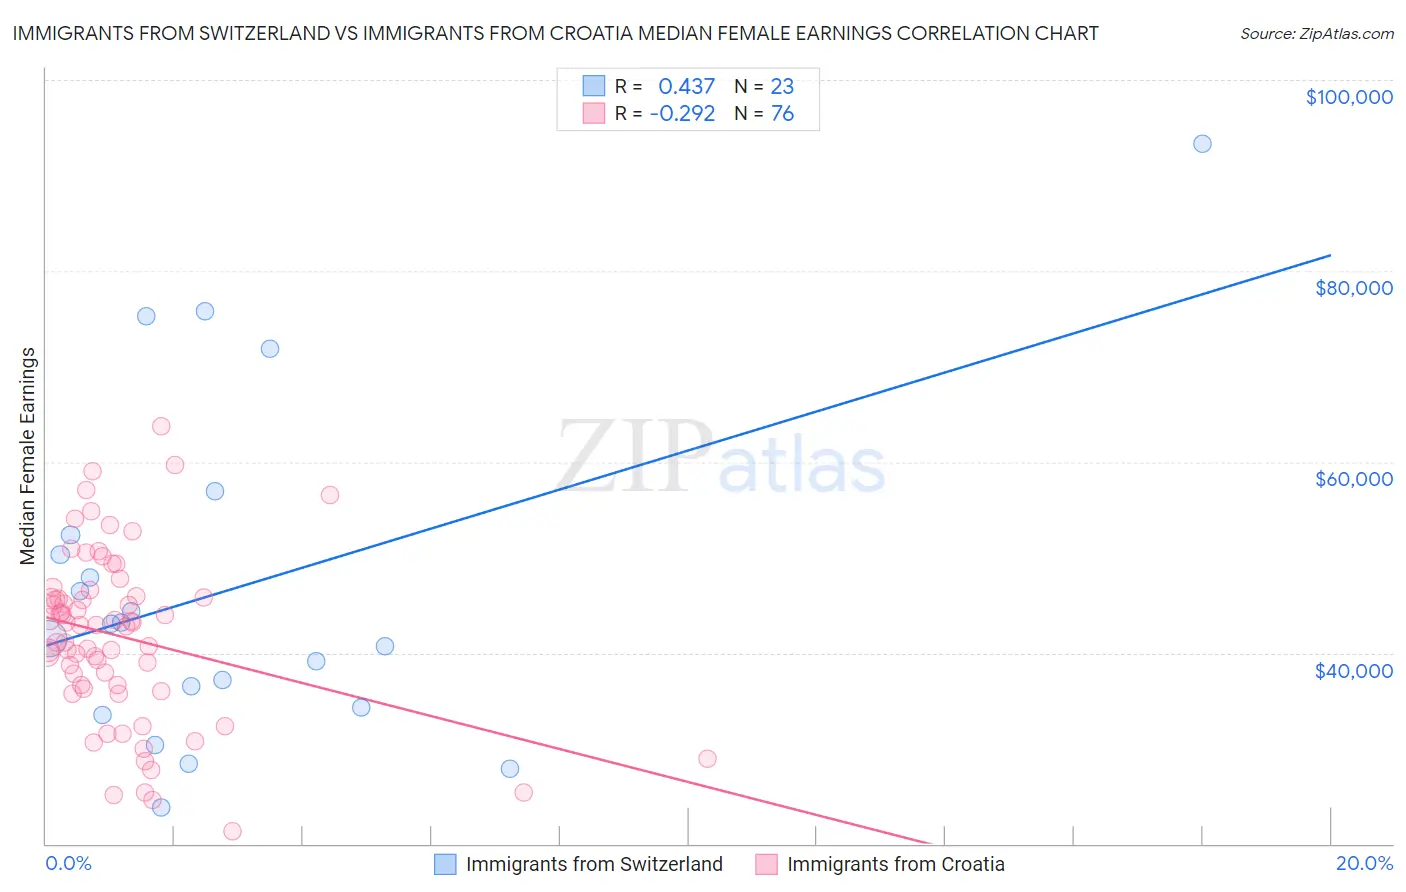
Immigrants from Switzerland vs Immigrants from Croatia Median Female Earnings Correlation Chart
The statistical analysis conducted on geographies consisting of 148,042,393 people shows a moderate positive correlation between the proportion of Immigrants from Switzerland and median female earnings in the United States with a correlation coefficient (R) of 0.437 and weighted average of $43,996. Similarly, the statistical analysis conducted on geographies consisting of 132,568,368 people shows a weak negative correlation between the proportion of Immigrants from Croatia and median female earnings in the United States with a correlation coefficient (R) of -0.292 and weighted average of $43,258, a difference of 1.7%.
Median Female Earnings Correlation Summary
| Measurement | Immigrants from Switzerland | Immigrants from Croatia |
| Minimum | $23,823 | $21,250 |
| Maximum | $93,289 | $63,753 |
| Range | $69,466 | $42,503 |
| Mean | $46,683 | $41,680 |
| Median | $43,003 | $42,916 |
| Interquartile 25% (IQ1) | $34,297 | $36,403 |
| Interquartile 75% (IQ3) | $52,304 | $45,910 |
| Interquartile Range (IQR) | $18,007 | $9,507 |
| Standard Deviation (Sample) | $17,546 | $8,879 |
| Standard Deviation (Population) | $17,160 | $8,820 |
Demographics Similar to Immigrants from Switzerland and Immigrants from Croatia by Median Female Earnings
In terms of median female earnings, the demographic groups most similar to Immigrants from Switzerland are Latvian ($43,941, a difference of 0.12%), Immigrants from Turkey ($44,066, a difference of 0.16%), Israeli ($43,852, a difference of 0.33%), Immigrants from Malaysia ($43,835, a difference of 0.37%), and Bhutanese ($43,648, a difference of 0.80%). Similarly, the demographic groups most similar to Immigrants from Croatia are Australian ($43,308, a difference of 0.11%), Egyptian ($43,305, a difference of 0.11%), Immigrants from Eastern Europe ($43,309, a difference of 0.12%), Immigrants from Lithuania ($43,317, a difference of 0.14%), and Maltese ($43,357, a difference of 0.23%).
| Demographics | Rating | Rank | Median Female Earnings |
| Immigrants | Turkey | 100.0 /100 | #36 | Exceptional $44,066 |
| Immigrants | Switzerland | 100.0 /100 | #37 | Exceptional $43,996 |
| Latvians | 100.0 /100 | #38 | Exceptional $43,941 |
| Israelis | 100.0 /100 | #39 | Exceptional $43,852 |
| Immigrants | Malaysia | 100.0 /100 | #40 | Exceptional $43,835 |
| Bhutanese | 100.0 /100 | #41 | Exceptional $43,648 |
| Immigrants | Denmark | 100.0 /100 | #42 | Exceptional $43,646 |
| Bulgarians | 100.0 /100 | #43 | Exceptional $43,638 |
| Immigrants | Czechoslovakia | 100.0 /100 | #44 | Exceptional $43,571 |
| Immigrants | Europe | 100.0 /100 | #45 | Exceptional $43,523 |
| Immigrants | Bolivia | 100.0 /100 | #46 | Exceptional $43,467 |
| Bolivians | 100.0 /100 | #47 | Exceptional $43,445 |
| Immigrants | Indonesia | 100.0 /100 | #48 | Exceptional $43,412 |
| Immigrants | Serbia | 100.0 /100 | #49 | Exceptional $43,385 |
| Immigrants | Uzbekistan | 100.0 /100 | #50 | Exceptional $43,363 |
| Maltese | 100.0 /100 | #51 | Exceptional $43,357 |
| Immigrants | Lithuania | 99.9 /100 | #52 | Exceptional $43,317 |
| Immigrants | Eastern Europe | 99.9 /100 | #53 | Exceptional $43,309 |
| Australians | 99.9 /100 | #54 | Exceptional $43,308 |
| Egyptians | 99.9 /100 | #55 | Exceptional $43,305 |
| Immigrants | Croatia | 99.9 /100 | #56 | Exceptional $43,258 |