Immigrants from Oceania vs Bolivian Ambulatory Disability
COMPARE
Immigrants from Oceania
Bolivian
Ambulatory Disability
Ambulatory Disability Comparison
Immigrants from Oceania
Bolivians
6.1%
AMBULATORY DISABILITY
60.7/ 100
METRIC RATING
167th/ 347
METRIC RANK
5.1%
AMBULATORY DISABILITY
100.0/ 100
METRIC RATING
7th/ 347
METRIC RANK
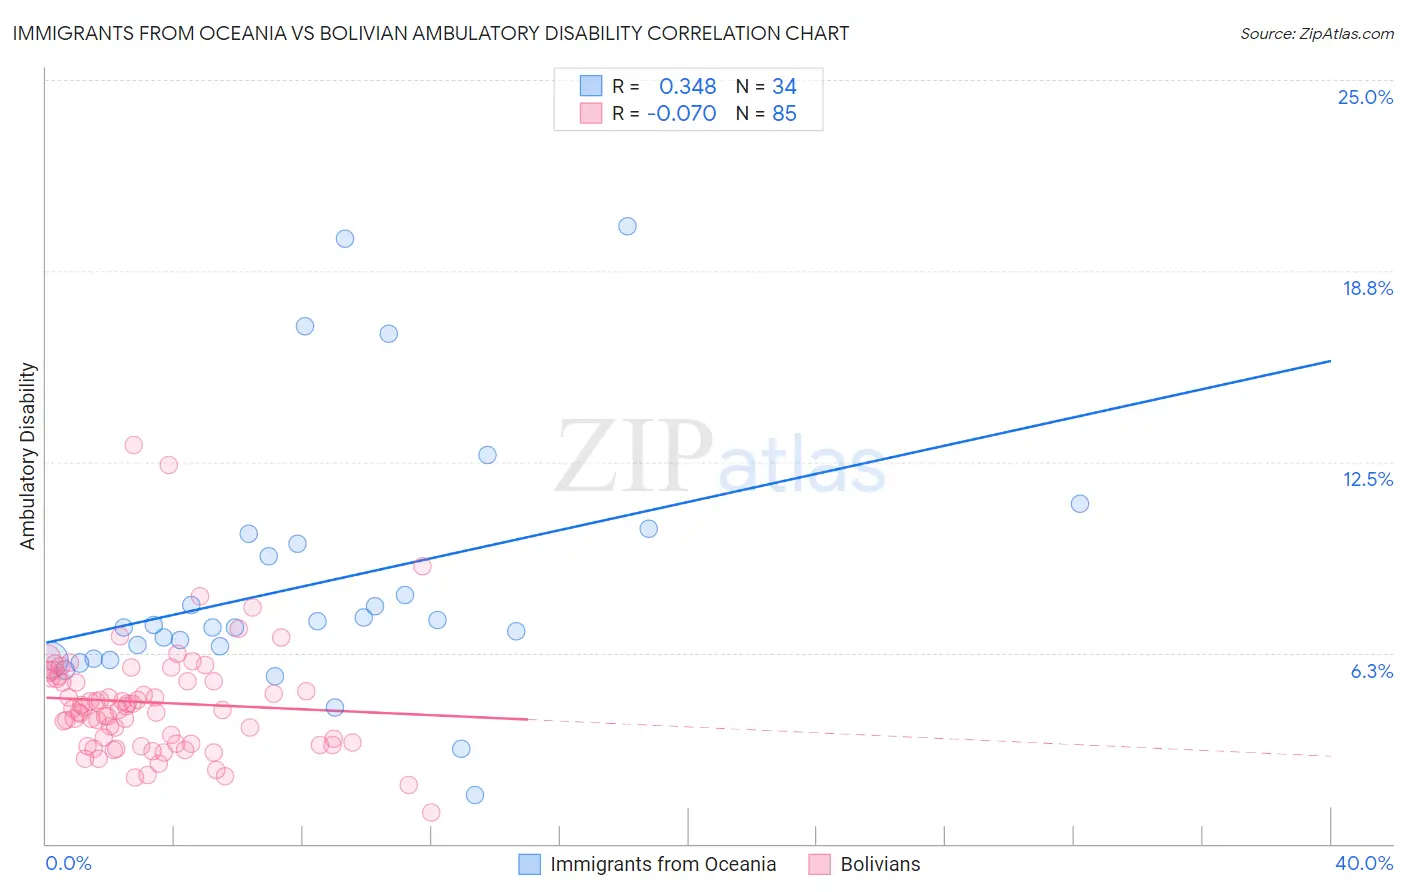
Immigrants from Oceania vs Bolivian Ambulatory Disability Correlation Chart
The statistical analysis conducted on geographies consisting of 305,408,228 people shows a mild positive correlation between the proportion of Immigrants from Oceania and percentage of population with ambulatory disability in the United States with a correlation coefficient (R) of 0.348 and weighted average of 6.1%. Similarly, the statistical analysis conducted on geographies consisting of 184,650,218 people shows a slight negative correlation between the proportion of Bolivians and percentage of population with ambulatory disability in the United States with a correlation coefficient (R) of -0.070 and weighted average of 5.1%, a difference of 20.3%.
Ambulatory Disability Correlation Summary
| Measurement | Immigrants from Oceania | Bolivian |
| Minimum | 1.6% | 1.0% |
| Maximum | 20.2% | 13.1% |
| Range | 18.6% | 12.0% |
| Mean | 8.5% | 4.6% |
| Median | 7.1% | 4.4% |
| Interquartile 25% (IQ1) | 6.1% | 3.3% |
| Interquartile 75% (IQ3) | 9.8% | 5.4% |
| Interquartile Range (IQR) | 3.8% | 2.1% |
| Standard Deviation (Sample) | 4.3% | 1.9% |
| Standard Deviation (Population) | 4.2% | 1.9% |
Similar Demographics by Ambulatory Disability
Demographics Similar to Immigrants from Oceania by Ambulatory Disability
In terms of ambulatory disability, the demographic groups most similar to Immigrants from Oceania are Ecuadorian (6.1%, a difference of 0.010%), Iraqi (6.1%, a difference of 0.12%), Nicaraguan (6.1%, a difference of 0.14%), Immigrants from Southern Europe (6.1%, a difference of 0.15%), and Basque (6.1%, a difference of 0.17%).
| Demographics | Rating | Rank | Ambulatory Disability |
| Central Americans | 69.8 /100 | #160 | Good 6.0% |
| Immigrants | Belarus | 69.2 /100 | #161 | Good 6.1% |
| Nigerians | 67.1 /100 | #162 | Good 6.1% |
| Lebanese | 66.2 /100 | #163 | Good 6.1% |
| Basques | 63.7 /100 | #164 | Good 6.1% |
| Nicaraguans | 63.2 /100 | #165 | Good 6.1% |
| Iraqis | 62.8 /100 | #166 | Good 6.1% |
| Immigrants | Oceania | 60.7 /100 | #167 | Good 6.1% |
| Ecuadorians | 60.5 /100 | #168 | Good 6.1% |
| Immigrants | Southern Europe | 58.1 /100 | #169 | Average 6.1% |
| Immigrants | Ecuador | 53.8 /100 | #170 | Average 6.1% |
| Moroccans | 52.6 /100 | #171 | Average 6.1% |
| Immigrants | Burma/Myanmar | 52.2 /100 | #172 | Average 6.1% |
| Croatians | 51.2 /100 | #173 | Average 6.1% |
| Immigrants | Canada | 50.0 /100 | #174 | Average 6.1% |
Demographics Similar to Bolivians by Ambulatory Disability
In terms of ambulatory disability, the demographic groups most similar to Bolivians are Immigrants from Bolivia (5.0%, a difference of 0.38%), Immigrants from South Central Asia (5.1%, a difference of 0.99%), Immigrants from Singapore (5.0%, a difference of 1.1%), Iranian (5.1%, a difference of 1.4%), and Yup'ik (5.2%, a difference of 2.0%).
| Demographics | Rating | Rank | Ambulatory Disability |
| Immigrants | India | 100.0 /100 | #1 | Exceptional 4.8% |
| Filipinos | 100.0 /100 | #2 | Exceptional 4.9% |
| Thais | 100.0 /100 | #3 | Exceptional 4.9% |
| Immigrants | Taiwan | 100.0 /100 | #4 | Exceptional 4.9% |
| Immigrants | Singapore | 100.0 /100 | #5 | Exceptional 5.0% |
| Immigrants | Bolivia | 100.0 /100 | #6 | Exceptional 5.0% |
| Bolivians | 100.0 /100 | #7 | Exceptional 5.1% |
| Immigrants | South Central Asia | 100.0 /100 | #8 | Exceptional 5.1% |
| Iranians | 100.0 /100 | #9 | Exceptional 5.1% |
| Yup'ik | 100.0 /100 | #10 | Exceptional 5.2% |
| Immigrants | Korea | 100.0 /100 | #11 | Exceptional 5.2% |
| Okinawans | 100.0 /100 | #12 | Exceptional 5.3% |
| Burmese | 100.0 /100 | #13 | Exceptional 5.3% |
| Immigrants | Eastern Asia | 100.0 /100 | #14 | Exceptional 5.3% |
| Immigrants | China | 100.0 /100 | #15 | Exceptional 5.3% |