Immigrants from Venezuela vs Bolivian 3 or more Vehicles in Household
COMPARE
Immigrants from Venezuela
Bolivian
3 or more Vehicles in Household
3 or more Vehicles in Household Comparison
Immigrants from Venezuela
Bolivians
17.7%
3 OR MORE VEHICLES IN HOUSEHOLD
0.8/ 100
METRIC RATING
267th/ 347
METRIC RANK
20.8%
3 OR MORE VEHICLES IN HOUSEHOLD
97.4/ 100
METRIC RATING
106th/ 347
METRIC RANK
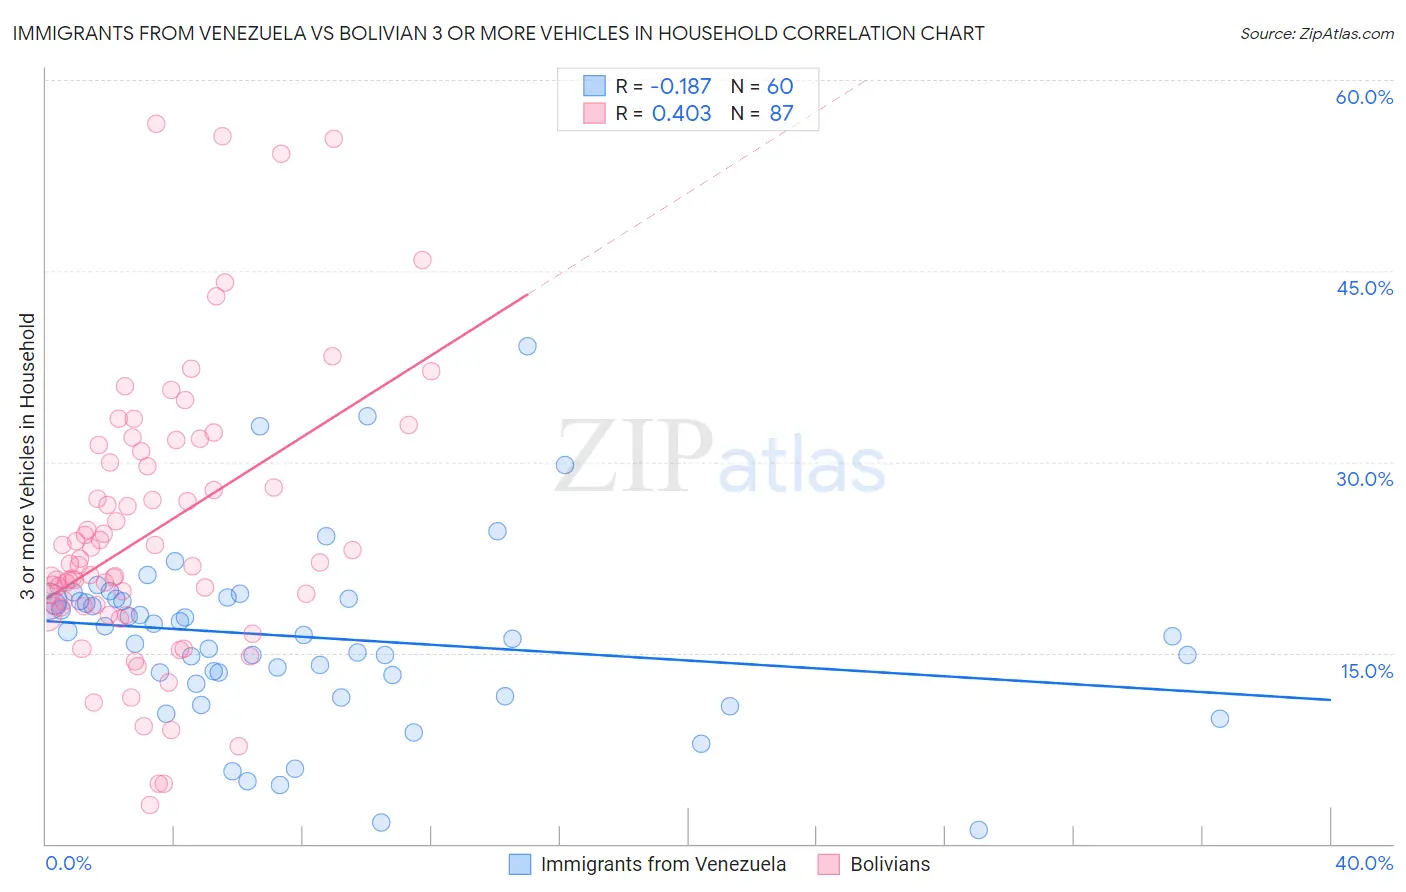
Immigrants from Venezuela vs Bolivian 3 or more Vehicles in Household Correlation Chart
The statistical analysis conducted on geographies consisting of 287,740,721 people shows a poor negative correlation between the proportion of Immigrants from Venezuela and percentage of households with 3 or more vehicles available in the United States with a correlation coefficient (R) of -0.187 and weighted average of 17.7%. Similarly, the statistical analysis conducted on geographies consisting of 184,604,965 people shows a moderate positive correlation between the proportion of Bolivians and percentage of households with 3 or more vehicles available in the United States with a correlation coefficient (R) of 0.403 and weighted average of 20.8%, a difference of 17.6%.
3 or more Vehicles in Household Correlation Summary
| Measurement | Immigrants from Venezuela | Bolivian |
| Minimum | 1.1% | 3.1% |
| Maximum | 39.1% | 56.5% |
| Range | 38.0% | 53.5% |
| Mean | 16.2% | 24.5% |
| Median | 16.3% | 22.0% |
| Interquartile 25% (IQ1) | 12.9% | 18.6% |
| Interquartile 75% (IQ3) | 19.1% | 30.8% |
| Interquartile Range (IQR) | 6.2% | 12.2% |
| Standard Deviation (Sample) | 7.0% | 10.9% |
| Standard Deviation (Population) | 7.0% | 10.9% |
Similar Demographics by 3 or more Vehicles in Household
Demographics Similar to Immigrants from Venezuela by 3 or more Vehicles in Household
In terms of 3 or more vehicles in household, the demographic groups most similar to Immigrants from Venezuela are Immigrants from Bulgaria (17.7%, a difference of 0.010%), Macedonian (17.7%, a difference of 0.050%), Immigrants from Panama (17.7%, a difference of 0.080%), Cambodian (17.8%, a difference of 0.21%), and Bermudan (17.8%, a difference of 0.24%).
| Demographics | Rating | Rank | 3 or more Vehicles in Household |
| Ugandans | 0.9 /100 | #260 | Tragic 17.8% |
| Immigrants | Northern Africa | 0.9 /100 | #261 | Tragic 17.8% |
| Colombians | 0.9 /100 | #262 | Tragic 17.8% |
| Bermudans | 0.9 /100 | #263 | Tragic 17.8% |
| Cambodians | 0.9 /100 | #264 | Tragic 17.8% |
| Immigrants | Panama | 0.8 /100 | #265 | Tragic 17.7% |
| Macedonians | 0.8 /100 | #266 | Tragic 17.7% |
| Immigrants | Venezuela | 0.8 /100 | #267 | Tragic 17.7% |
| Immigrants | Bulgaria | 0.8 /100 | #268 | Tragic 17.7% |
| Immigrants | France | 0.6 /100 | #269 | Tragic 17.6% |
| Immigrants | Nepal | 0.6 /100 | #270 | Tragic 17.6% |
| South Americans | 0.6 /100 | #271 | Tragic 17.6% |
| Immigrants | Africa | 0.5 /100 | #272 | Tragic 17.6% |
| Immigrants | Sudan | 0.5 /100 | #273 | Tragic 17.6% |
| Immigrants | Bosnia and Herzegovina | 0.5 /100 | #274 | Tragic 17.5% |
Demographics Similar to Bolivians by 3 or more Vehicles in Household
In terms of 3 or more vehicles in household, the demographic groups most similar to Bolivians are Immigrants from Germany (20.8%, a difference of 0.040%), Austrian (20.9%, a difference of 0.090%), Immigrants from Scotland (20.8%, a difference of 0.19%), Luxembourger (20.9%, a difference of 0.20%), and Filipino (20.8%, a difference of 0.25%).
| Demographics | Rating | Rank | 3 or more Vehicles in Household |
| Alaska Natives | 98.2 /100 | #99 | Exceptional 21.0% |
| Comanche | 98.2 /100 | #100 | Exceptional 21.0% |
| Blackfeet | 97.9 /100 | #101 | Exceptional 20.9% |
| Seminole | 97.8 /100 | #102 | Exceptional 20.9% |
| Dutch West Indians | 97.8 /100 | #103 | Exceptional 20.9% |
| Luxembourgers | 97.7 /100 | #104 | Exceptional 20.9% |
| Austrians | 97.5 /100 | #105 | Exceptional 20.9% |
| Bolivians | 97.4 /100 | #106 | Exceptional 20.8% |
| Immigrants | Germany | 97.4 /100 | #107 | Exceptional 20.8% |
| Immigrants | Scotland | 97.1 /100 | #108 | Exceptional 20.8% |
| Filipinos | 97.0 /100 | #109 | Exceptional 20.8% |
| Asians | 96.8 /100 | #110 | Exceptional 20.8% |
| Immigrants | Micronesia | 96.7 /100 | #111 | Exceptional 20.7% |
| Nicaraguans | 96.2 /100 | #112 | Exceptional 20.7% |
| Immigrants | England | 96.2 /100 | #113 | Exceptional 20.7% |