Immigrants from Oceania vs Bolivian High School Diploma
COMPARE
Immigrants from Oceania
Bolivian
High School Diploma
High School Diploma Comparison
Immigrants from Oceania
Bolivians
88.8%
HIGH SCHOOL DIPLOMA
26.9/ 100
METRIC RATING
193rd/ 347
METRIC RANK
89.1%
HIGH SCHOOL DIPLOMA
45.2/ 100
METRIC RATING
180th/ 347
METRIC RANK
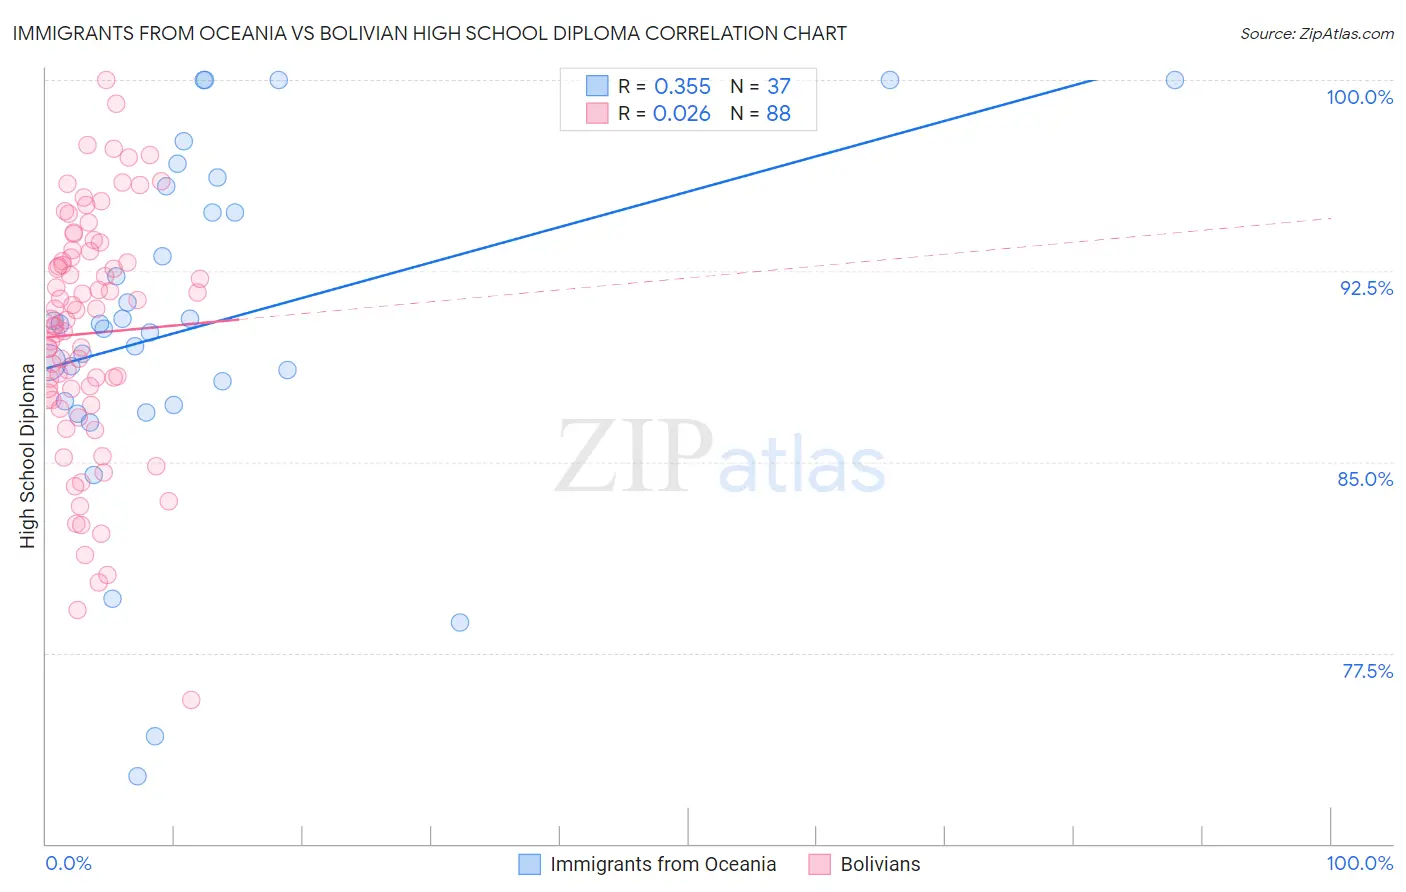
Immigrants from Oceania vs Bolivian High School Diploma Correlation Chart
The statistical analysis conducted on geographies consisting of 305,521,521 people shows a mild positive correlation between the proportion of Immigrants from Oceania and percentage of population with at least high school diploma education in the United States with a correlation coefficient (R) of 0.355 and weighted average of 88.8%. Similarly, the statistical analysis conducted on geographies consisting of 184,667,452 people shows no correlation between the proportion of Bolivians and percentage of population with at least high school diploma education in the United States with a correlation coefficient (R) of 0.026 and weighted average of 89.1%, a difference of 0.31%.
High School Diploma Correlation Summary
| Measurement | Immigrants from Oceania | Bolivian |
| Minimum | 72.6% | 75.6% |
| Maximum | 100.0% | 100.0% |
| Range | 27.4% | 24.4% |
| Mean | 90.4% | 90.0% |
| Median | 90.4% | 90.6% |
| Interquartile 25% (IQ1) | 87.3% | 87.5% |
| Interquartile 75% (IQ3) | 95.3% | 93.2% |
| Interquartile Range (IQR) | 8.0% | 5.6% |
| Standard Deviation (Sample) | 6.7% | 4.8% |
| Standard Deviation (Population) | 6.6% | 4.7% |
Demographics Similar to Immigrants from Oceania and Bolivians by High School Diploma
In terms of high school diploma, the demographic groups most similar to Immigrants from Oceania are Immigrants from Venezuela (88.8%, a difference of 0.020%), Moroccan (88.8%, a difference of 0.050%), Afghan (88.8%, a difference of 0.060%), Immigrants from Ethiopia (88.9%, a difference of 0.070%), and Immigrants from Southern Europe (88.7%, a difference of 0.070%). Similarly, the demographic groups most similar to Bolivians are Venezuelan (89.1%, a difference of 0.020%), American (89.1%, a difference of 0.030%), Spaniard (89.1%, a difference of 0.030%), Potawatomi (89.0%, a difference of 0.040%), and Sudanese (89.1%, a difference of 0.050%).
| Demographics | Rating | Rank | High School Diploma |
| Osage | 48.9 /100 | #176 | Average 89.1% |
| Sudanese | 48.5 /100 | #177 | Average 89.1% |
| Sierra Leoneans | 48.4 /100 | #178 | Average 89.1% |
| Americans | 47.2 /100 | #179 | Average 89.1% |
| Bolivians | 45.2 /100 | #180 | Average 89.1% |
| Venezuelans | 43.6 /100 | #181 | Average 89.1% |
| Spaniards | 43.4 /100 | #182 | Average 89.1% |
| Potawatomi | 42.5 /100 | #183 | Average 89.0% |
| Immigrants | Syria | 39.2 /100 | #184 | Fair 89.0% |
| Ethiopians | 37.0 /100 | #185 | Fair 89.0% |
| Immigrants | Eastern Africa | 35.8 /100 | #186 | Fair 88.9% |
| Guamanians/Chamorros | 35.5 /100 | #187 | Fair 88.9% |
| Immigrants | Sudan | 33.4 /100 | #188 | Fair 88.9% |
| Immigrants | Uganda | 32.6 /100 | #189 | Fair 88.9% |
| Immigrants | Chile | 31.9 /100 | #190 | Fair 88.9% |
| Immigrants | Ethiopia | 30.9 /100 | #191 | Fair 88.9% |
| Moroccans | 29.5 /100 | #192 | Fair 88.8% |
| Immigrants | Oceania | 26.9 /100 | #193 | Fair 88.8% |
| Immigrants | Venezuela | 25.8 /100 | #194 | Fair 88.8% |
| Afghans | 23.9 /100 | #195 | Fair 88.8% |
| Immigrants | Southern Europe | 23.4 /100 | #196 | Fair 88.7% |