Immigrants from Nigeria vs Arab 3 or more Vehicles in Household
COMPARE
Immigrants from Nigeria
Arab
3 or more Vehicles in Household
3 or more Vehicles in Household Comparison
Immigrants from Nigeria
Arabs
18.7%
3 OR MORE VEHICLES IN HOUSEHOLD
10.3/ 100
METRIC RATING
216th/ 347
METRIC RANK
18.9%
3 OR MORE VEHICLES IN HOUSEHOLD
17.7/ 100
METRIC RATING
201st/ 347
METRIC RANK
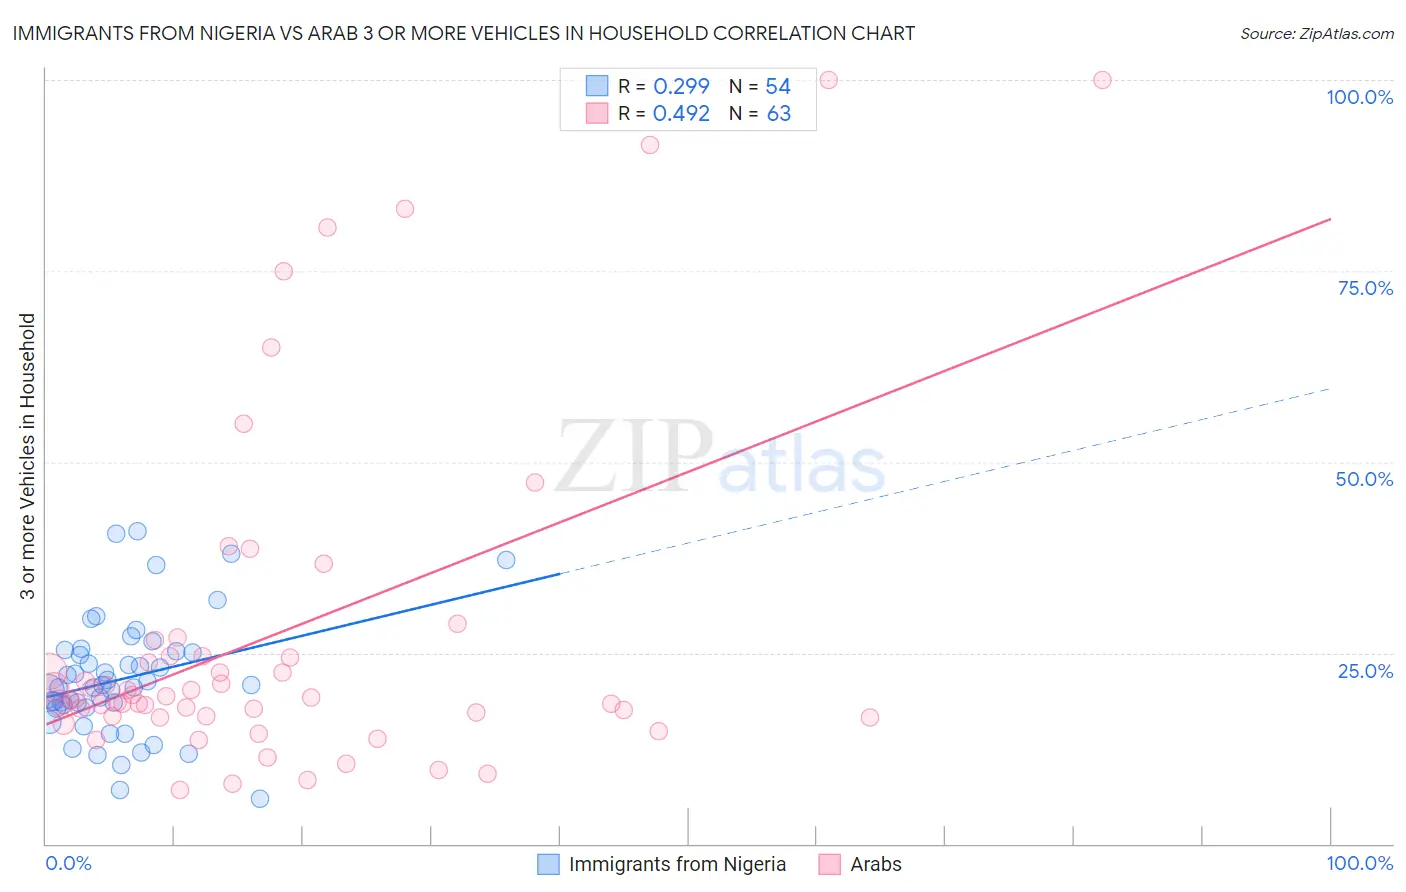
Immigrants from Nigeria vs Arab 3 or more Vehicles in Household Correlation Chart
The statistical analysis conducted on geographies consisting of 283,187,528 people shows a weak positive correlation between the proportion of Immigrants from Nigeria and percentage of households with 3 or more vehicles available in the United States with a correlation coefficient (R) of 0.299 and weighted average of 18.7%. Similarly, the statistical analysis conducted on geographies consisting of 486,191,468 people shows a moderate positive correlation between the proportion of Arabs and percentage of households with 3 or more vehicles available in the United States with a correlation coefficient (R) of 0.492 and weighted average of 18.9%, a difference of 1.2%.
3 or more Vehicles in Household Correlation Summary
| Measurement | Immigrants from Nigeria | Arab |
| Minimum | 5.9% | 7.1% |
| Maximum | 40.9% | 100.0% |
| Range | 35.0% | 92.9% |
| Mean | 21.6% | 27.5% |
| Median | 20.6% | 19.1% |
| Interquartile 25% (IQ1) | 17.9% | 16.7% |
| Interquartile 75% (IQ3) | 25.2% | 24.6% |
| Interquartile Range (IQR) | 7.3% | 7.9% |
| Standard Deviation (Sample) | 7.8% | 22.5% |
| Standard Deviation (Population) | 7.7% | 22.3% |
Demographics Similar to Immigrants from Nigeria and Arabs by 3 or more Vehicles in Household
In terms of 3 or more vehicles in household, the demographic groups most similar to Immigrants from Nigeria are Immigrants from Italy (18.7%, a difference of 0.020%), Eastern European (18.7%, a difference of 0.060%), Immigrants from Sierra Leone (18.7%, a difference of 0.10%), Panamanian (18.8%, a difference of 0.26%), and Immigrants from Cuba (18.8%, a difference of 0.26%). Similarly, the demographic groups most similar to Arabs are Argentinean (18.9%, a difference of 0.060%), Immigrants from Norway (19.0%, a difference of 0.16%), Egyptian (19.0%, a difference of 0.22%), Immigrants from Austria (18.9%, a difference of 0.33%), and Tohono O'odham (18.9%, a difference of 0.42%).
| Demographics | Rating | Rank | 3 or more Vehicles in Household |
| Egyptians | 19.5 /100 | #198 | Poor 19.0% |
| Immigrants | Norway | 19.0 /100 | #199 | Poor 19.0% |
| Argentineans | 18.2 /100 | #200 | Poor 18.9% |
| Arabs | 17.7 /100 | #201 | Poor 18.9% |
| Immigrants | Austria | 15.4 /100 | #202 | Poor 18.9% |
| Tohono O'odham | 14.8 /100 | #203 | Poor 18.9% |
| Immigrants | Romania | 14.6 /100 | #204 | Poor 18.9% |
| Russians | 14.2 /100 | #205 | Poor 18.8% |
| Immigrants | Eastern Asia | 14.1 /100 | #206 | Poor 18.8% |
| Immigrants | Chile | 13.6 /100 | #207 | Poor 18.8% |
| Immigrants | Burma/Myanmar | 13.6 /100 | #208 | Poor 18.8% |
| Immigrants | Egypt | 13.5 /100 | #209 | Poor 18.8% |
| Bulgarians | 13.1 /100 | #210 | Poor 18.8% |
| Immigrants | Kenya | 12.4 /100 | #211 | Poor 18.8% |
| Panamanians | 11.6 /100 | #212 | Poor 18.8% |
| Immigrants | Cuba | 11.6 /100 | #213 | Poor 18.8% |
| Immigrants | Sierra Leone | 10.8 /100 | #214 | Poor 18.7% |
| Eastern Europeans | 10.6 /100 | #215 | Poor 18.7% |
| Immigrants | Nigeria | 10.3 /100 | #216 | Poor 18.7% |
| Immigrants | Italy | 10.2 /100 | #217 | Poor 18.7% |
| Immigrants | Portugal | 8.9 /100 | #218 | Tragic 18.6% |