Immigrants from Micronesia vs Arab Child Poverty Under the Age of 5
COMPARE
Immigrants from Micronesia
Arab
Child Poverty Under the Age of 5
Child Poverty Under the Age of 5 Comparison
Immigrants from Micronesia
Arabs
19.4%
CHILD POVERTY UNDER THE AGE OF 5
0.9/ 100
METRIC RATING
234th/ 347
METRIC RANK
17.4%
CHILD POVERTY UNDER THE AGE OF 5
40.7/ 100
METRIC RATING
182nd/ 347
METRIC RANK
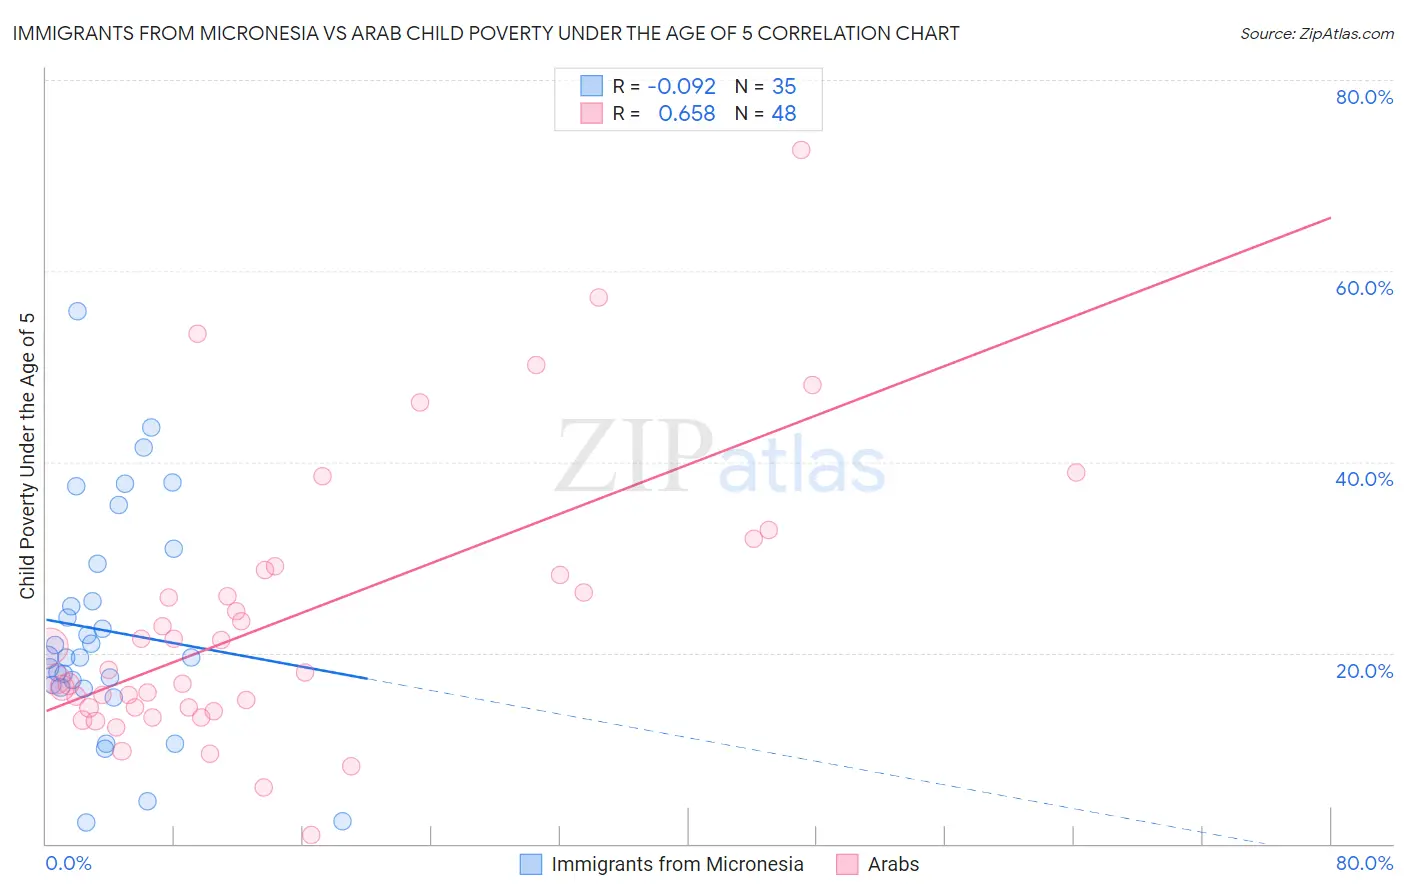
Immigrants from Micronesia vs Arab Child Poverty Under the Age of 5 Correlation Chart
The statistical analysis conducted on geographies consisting of 61,294,346 people shows a slight negative correlation between the proportion of Immigrants from Micronesia and poverty level among children under the age of 5 in the United States with a correlation coefficient (R) of -0.092 and weighted average of 19.4%. Similarly, the statistical analysis conducted on geographies consisting of 461,564,748 people shows a significant positive correlation between the proportion of Arabs and poverty level among children under the age of 5 in the United States with a correlation coefficient (R) of 0.658 and weighted average of 17.4%, a difference of 11.2%.
Child Poverty Under the Age of 5 Correlation Summary
| Measurement | Immigrants from Micronesia | Arab |
| Minimum | 2.3% | 0.94% |
| Maximum | 55.8% | 72.7% |
| Range | 53.5% | 71.8% |
| Mean | 22.3% | 23.4% |
| Median | 19.5% | 18.1% |
| Interquartile 25% (IQ1) | 16.4% | 14.3% |
| Interquartile 75% (IQ3) | 29.4% | 28.4% |
| Interquartile Range (IQR) | 12.9% | 14.2% |
| Standard Deviation (Sample) | 11.9% | 14.5% |
| Standard Deviation (Population) | 11.7% | 14.4% |
Similar Demographics by Child Poverty Under the Age of 5
Demographics Similar to Immigrants from Micronesia by Child Poverty Under the Age of 5
In terms of child poverty under the age of 5, the demographic groups most similar to Immigrants from Micronesia are Sudanese (19.3%, a difference of 0.12%), Trinidadian and Tobagonian (19.3%, a difference of 0.18%), Immigrants from Laos (19.4%, a difference of 0.21%), Immigrants from Trinidad and Tobago (19.4%, a difference of 0.21%), and Bermudan (19.2%, a difference of 0.74%).
| Demographics | Rating | Rank | Child Poverty Under the Age of 5 |
| Cape Verdeans | 1.4 /100 | #227 | Tragic 19.1% |
| Immigrants | Sudan | 1.3 /100 | #228 | Tragic 19.2% |
| Ghanaians | 1.2 /100 | #229 | Tragic 19.2% |
| Ecuadorians | 1.2 /100 | #230 | Tragic 19.2% |
| Bermudans | 1.2 /100 | #231 | Tragic 19.2% |
| Trinidadians and Tobagonians | 0.9 /100 | #232 | Tragic 19.3% |
| Sudanese | 0.9 /100 | #233 | Tragic 19.3% |
| Immigrants | Micronesia | 0.9 /100 | #234 | Tragic 19.4% |
| Immigrants | Laos | 0.8 /100 | #235 | Tragic 19.4% |
| Immigrants | Trinidad and Tobago | 0.8 /100 | #236 | Tragic 19.4% |
| Immigrants | Cabo Verde | 0.6 /100 | #237 | Tragic 19.5% |
| Salvadorans | 0.6 /100 | #238 | Tragic 19.5% |
| Vietnamese | 0.6 /100 | #239 | Tragic 19.5% |
| Immigrants | Ecuador | 0.5 /100 | #240 | Tragic 19.6% |
| Alaska Natives | 0.5 /100 | #241 | Tragic 19.6% |
Demographics Similar to Arabs by Child Poverty Under the Age of 5
In terms of child poverty under the age of 5, the demographic groups most similar to Arabs are Immigrants from Germany (17.4%, a difference of 0.030%), Lebanese (17.4%, a difference of 0.040%), Hawaiian (17.4%, a difference of 0.080%), South American Indian (17.4%, a difference of 0.080%), and Immigrants from Costa Rica (17.4%, a difference of 0.18%).
| Demographics | Rating | Rank | Child Poverty Under the Age of 5 |
| Immigrants | Lebanon | 47.6 /100 | #175 | Average 17.3% |
| Immigrants | Iraq | 45.2 /100 | #176 | Average 17.3% |
| Immigrants | Sierra Leone | 43.6 /100 | #177 | Average 17.3% |
| Immigrants | Cameroon | 42.7 /100 | #178 | Average 17.4% |
| Hawaiians | 41.5 /100 | #179 | Average 17.4% |
| South American Indians | 41.4 /100 | #180 | Average 17.4% |
| Immigrants | Germany | 41.0 /100 | #181 | Average 17.4% |
| Arabs | 40.7 /100 | #182 | Average 17.4% |
| Lebanese | 40.3 /100 | #183 | Average 17.4% |
| Immigrants | Costa Rica | 39.0 /100 | #184 | Fair 17.4% |
| Immigrants | Armenia | 38.0 /100 | #185 | Fair 17.5% |
| Immigrants | Bosnia and Herzegovina | 35.0 /100 | #186 | Fair 17.5% |
| Kenyans | 34.7 /100 | #187 | Fair 17.5% |
| Carpatho Rusyns | 33.6 /100 | #188 | Fair 17.5% |
| French | 33.6 /100 | #189 | Fair 17.5% |