Chinese vs Immigrants from Japan 2 or more Vehicles in Household
COMPARE
Chinese
Immigrants from Japan
2 or more Vehicles in Household
2 or more Vehicles in Household Comparison
Chinese
Immigrants from Japan
60.1%
2 OR MORE VEHICLES IN HOUSEHOLD
100.0/ 100
METRIC RATING
36th/ 347
METRIC RANK
54.7%
2 OR MORE VEHICLES IN HOUSEHOLD
23.4/ 100
METRIC RATING
193rd/ 347
METRIC RANK
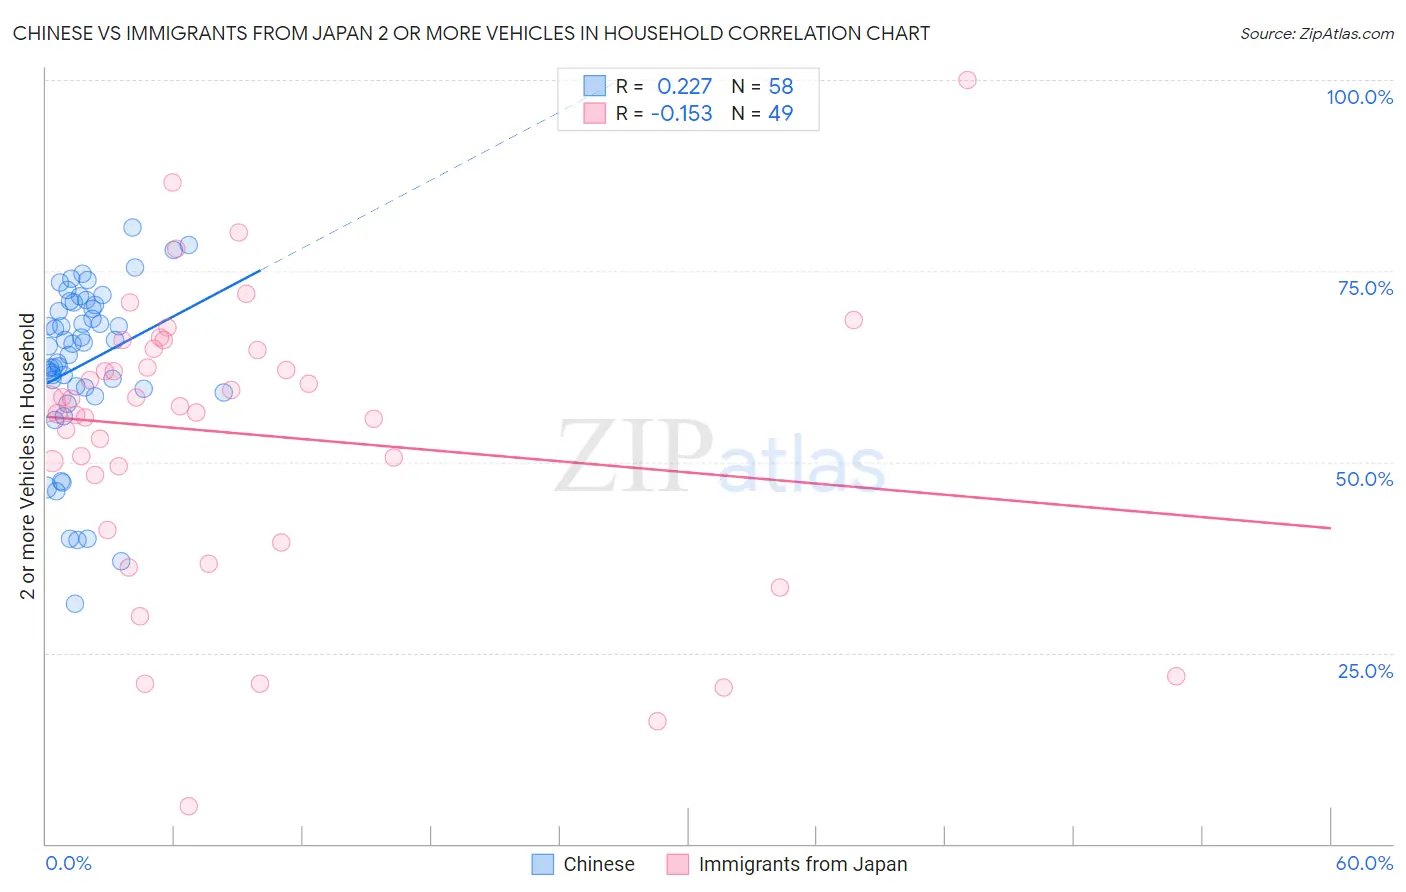
Chinese vs Immigrants from Japan 2 or more Vehicles in Household Correlation Chart
The statistical analysis conducted on geographies consisting of 64,802,428 people shows a weak positive correlation between the proportion of Chinese and percentage of households with 2 or more vehicles available in the United States with a correlation coefficient (R) of 0.227 and weighted average of 60.1%. Similarly, the statistical analysis conducted on geographies consisting of 340,014,112 people shows a poor negative correlation between the proportion of Immigrants from Japan and percentage of households with 2 or more vehicles available in the United States with a correlation coefficient (R) of -0.153 and weighted average of 54.7%, a difference of 9.9%.
2 or more Vehicles in Household Correlation Summary
| Measurement | Chinese | Immigrants from Japan |
| Minimum | 31.5% | 4.9% |
| Maximum | 80.6% | 100.0% |
| Range | 49.2% | 95.1% |
| Mean | 62.8% | 53.6% |
| Median | 65.3% | 57.3% |
| Interquartile 25% (IQ1) | 59.5% | 44.7% |
| Interquartile 75% (IQ3) | 70.6% | 64.8% |
| Interquartile Range (IQR) | 11.1% | 20.1% |
| Standard Deviation (Sample) | 10.9% | 18.7% |
| Standard Deviation (Population) | 10.8% | 18.5% |
Similar Demographics by 2 or more Vehicles in Household
Demographics Similar to Chinese by 2 or more Vehicles in Household
In terms of 2 or more vehicles in household, the demographic groups most similar to Chinese are Immigrants from Philippines (60.1%, a difference of 0.020%), Irish (60.1%, a difference of 0.030%), American (60.0%, a difference of 0.10%), British (60.0%, a difference of 0.10%), and Spanish (60.2%, a difference of 0.14%).
| Demographics | Rating | Rank | 2 or more Vehicles in Household |
| Hawaiians | 100.0 /100 | #29 | Exceptional 60.4% |
| Finns | 100.0 /100 | #30 | Exceptional 60.3% |
| Spanish American Indians | 100.0 /100 | #31 | Exceptional 60.3% |
| Arapaho | 100.0 /100 | #32 | Exceptional 60.2% |
| Immigrants | Mexico | 100.0 /100 | #33 | Exceptional 60.2% |
| Spanish | 100.0 /100 | #34 | Exceptional 60.2% |
| Immigrants | Philippines | 100.0 /100 | #35 | Exceptional 60.1% |
| Chinese | 100.0 /100 | #36 | Exceptional 60.1% |
| Irish | 100.0 /100 | #37 | Exceptional 60.1% |
| Americans | 100.0 /100 | #38 | Exceptional 60.0% |
| British | 100.0 /100 | #39 | Exceptional 60.0% |
| Cherokee | 100.0 /100 | #40 | Exceptional 59.9% |
| Northern Europeans | 100.0 /100 | #41 | Exceptional 59.9% |
| Malaysians | 100.0 /100 | #42 | Exceptional 59.8% |
| Czechoslovakians | 100.0 /100 | #43 | Exceptional 59.8% |
Demographics Similar to Immigrants from Japan by 2 or more Vehicles in Household
In terms of 2 or more vehicles in household, the demographic groups most similar to Immigrants from Japan are Immigrants from Romania (54.7%, a difference of 0.020%), Central American (54.7%, a difference of 0.020%), Iroquois (54.7%, a difference of 0.050%), Immigrants (54.7%, a difference of 0.090%), and Russian (54.8%, a difference of 0.16%).
| Demographics | Rating | Rank | 2 or more Vehicles in Household |
| Peruvians | 33.7 /100 | #186 | Fair 55.0% |
| Immigrants | Uganda | 33.4 /100 | #187 | Fair 55.0% |
| Marshallese | 30.5 /100 | #188 | Fair 54.9% |
| Eastern Europeans | 27.5 /100 | #189 | Fair 54.8% |
| Russians | 26.3 /100 | #190 | Fair 54.8% |
| Immigrants | Immigrants | 25.0 /100 | #191 | Fair 54.7% |
| Immigrants | Romania | 23.8 /100 | #192 | Fair 54.7% |
| Immigrants | Japan | 23.4 /100 | #193 | Fair 54.7% |
| Central Americans | 23.0 /100 | #194 | Fair 54.7% |
| Iroquois | 22.6 /100 | #195 | Fair 54.7% |
| Immigrants | Poland | 19.3 /100 | #196 | Poor 54.6% |
| Argentineans | 17.5 /100 | #197 | Poor 54.5% |
| Carpatho Rusyns | 16.2 /100 | #198 | Poor 54.4% |
| Immigrants | Norway | 15.9 /100 | #199 | Poor 54.4% |
| Houma | 15.8 /100 | #200 | Poor 54.4% |