Aleut vs Immigrants from Japan 2 or more Vehicles in Household
COMPARE
Aleut
Immigrants from Japan
2 or more Vehicles in Household
2 or more Vehicles in Household Comparison
Aleuts
Immigrants from Japan
54.1%
2 OR MORE VEHICLES IN HOUSEHOLD
9.3/ 100
METRIC RATING
215th/ 347
METRIC RANK
54.7%
2 OR MORE VEHICLES IN HOUSEHOLD
23.4/ 100
METRIC RATING
193rd/ 347
METRIC RANK
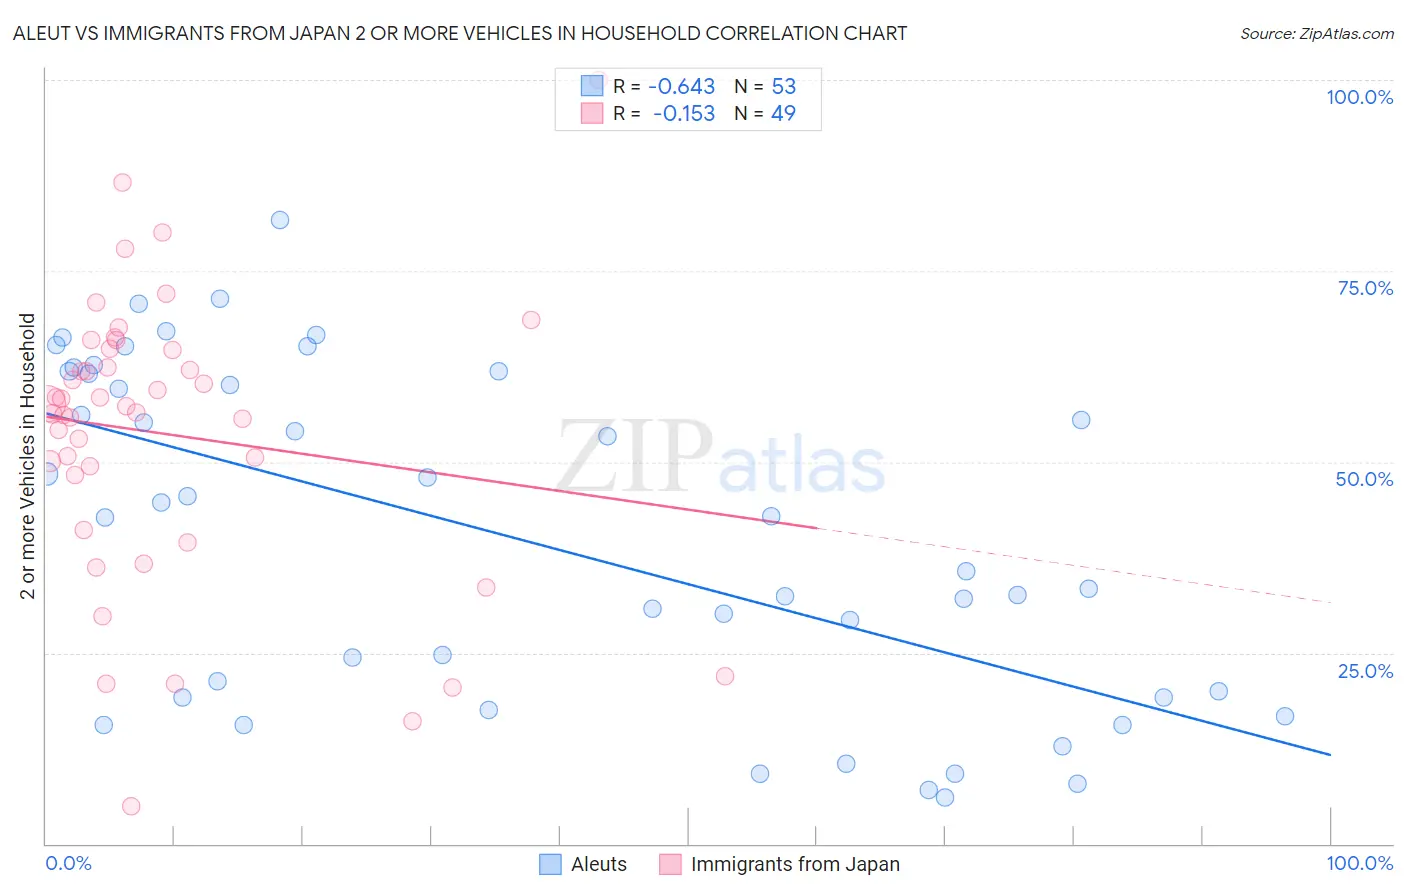
Aleut vs Immigrants from Japan 2 or more Vehicles in Household Correlation Chart
The statistical analysis conducted on geographies consisting of 61,767,595 people shows a significant negative correlation between the proportion of Aleuts and percentage of households with 2 or more vehicles available in the United States with a correlation coefficient (R) of -0.643 and weighted average of 54.1%. Similarly, the statistical analysis conducted on geographies consisting of 340,014,112 people shows a poor negative correlation between the proportion of Immigrants from Japan and percentage of households with 2 or more vehicles available in the United States with a correlation coefficient (R) of -0.153 and weighted average of 54.7%, a difference of 1.1%.
2 or more Vehicles in Household Correlation Summary
| Measurement | Aleut | Immigrants from Japan |
| Minimum | 6.1% | 4.9% |
| Maximum | 81.6% | 100.0% |
| Range | 75.6% | 95.1% |
| Mean | 40.1% | 53.6% |
| Median | 42.7% | 57.3% |
| Interquartile 25% (IQ1) | 19.2% | 44.7% |
| Interquartile 75% (IQ3) | 61.7% | 64.8% |
| Interquartile Range (IQR) | 42.5% | 20.1% |
| Standard Deviation (Sample) | 21.7% | 18.7% |
| Standard Deviation (Population) | 21.5% | 18.5% |
Similar Demographics by 2 or more Vehicles in Household
Demographics Similar to Aleuts by 2 or more Vehicles in Household
In terms of 2 or more vehicles in household, the demographic groups most similar to Aleuts are Immigrants from Western Asia (54.1%, a difference of 0.0%), Immigrants from Czechoslovakia (54.1%, a difference of 0.010%), Guatemalan (54.1%, a difference of 0.030%), Immigrants from Chile (54.2%, a difference of 0.20%), and Immigrants from Hungary (54.2%, a difference of 0.22%).
| Demographics | Rating | Rank | 2 or more Vehicles in Household |
| Egyptians | 12.0 /100 | #208 | Poor 54.3% |
| Immigrants | Bulgaria | 12.0 /100 | #209 | Poor 54.3% |
| Immigrants | Saudi Arabia | 11.3 /100 | #210 | Poor 54.2% |
| Immigrants | Hungary | 11.3 /100 | #211 | Poor 54.2% |
| Immigrants | Chile | 11.1 /100 | #212 | Poor 54.2% |
| Guatemalans | 9.6 /100 | #213 | Tragic 54.1% |
| Immigrants | Czechoslovakia | 9.4 /100 | #214 | Tragic 54.1% |
| Aleuts | 9.3 /100 | #215 | Tragic 54.1% |
| Immigrants | Western Asia | 9.3 /100 | #216 | Tragic 54.1% |
| Immigrants | Burma/Myanmar | 7.1 /100 | #217 | Tragic 53.9% |
| Immigrants | Argentina | 6.8 /100 | #218 | Tragic 53.9% |
| South American Indians | 6.5 /100 | #219 | Tragic 53.9% |
| Taiwanese | 6.3 /100 | #220 | Tragic 53.9% |
| Immigrants | Singapore | 6.3 /100 | #221 | Tragic 53.9% |
| Kiowa | 6.2 /100 | #222 | Tragic 53.9% |
Demographics Similar to Immigrants from Japan by 2 or more Vehicles in Household
In terms of 2 or more vehicles in household, the demographic groups most similar to Immigrants from Japan are Immigrants from Romania (54.7%, a difference of 0.020%), Central American (54.7%, a difference of 0.020%), Iroquois (54.7%, a difference of 0.050%), Immigrants (54.7%, a difference of 0.090%), and Russian (54.8%, a difference of 0.16%).
| Demographics | Rating | Rank | 2 or more Vehicles in Household |
| Peruvians | 33.7 /100 | #186 | Fair 55.0% |
| Immigrants | Uganda | 33.4 /100 | #187 | Fair 55.0% |
| Marshallese | 30.5 /100 | #188 | Fair 54.9% |
| Eastern Europeans | 27.5 /100 | #189 | Fair 54.8% |
| Russians | 26.3 /100 | #190 | Fair 54.8% |
| Immigrants | Immigrants | 25.0 /100 | #191 | Fair 54.7% |
| Immigrants | Romania | 23.8 /100 | #192 | Fair 54.7% |
| Immigrants | Japan | 23.4 /100 | #193 | Fair 54.7% |
| Central Americans | 23.0 /100 | #194 | Fair 54.7% |
| Iroquois | 22.6 /100 | #195 | Fair 54.7% |
| Immigrants | Poland | 19.3 /100 | #196 | Poor 54.6% |
| Argentineans | 17.5 /100 | #197 | Poor 54.5% |
| Carpatho Rusyns | 16.2 /100 | #198 | Poor 54.4% |
| Immigrants | Norway | 15.9 /100 | #199 | Poor 54.4% |
| Houma | 15.8 /100 | #200 | Poor 54.4% |