Immigrants from Latvia vs Afghan 3 or more Vehicles in Household
COMPARE
Immigrants from Latvia
Afghan
3 or more Vehicles in Household
3 or more Vehicles in Household Comparison
Immigrants from Latvia
Afghans
17.4%
3 OR MORE VEHICLES IN HOUSEHOLD
0.3/ 100
METRIC RATING
281st/ 347
METRIC RANK
21.7%
3 OR MORE VEHICLES IN HOUSEHOLD
99.7/ 100
METRIC RATING
80th/ 347
METRIC RANK
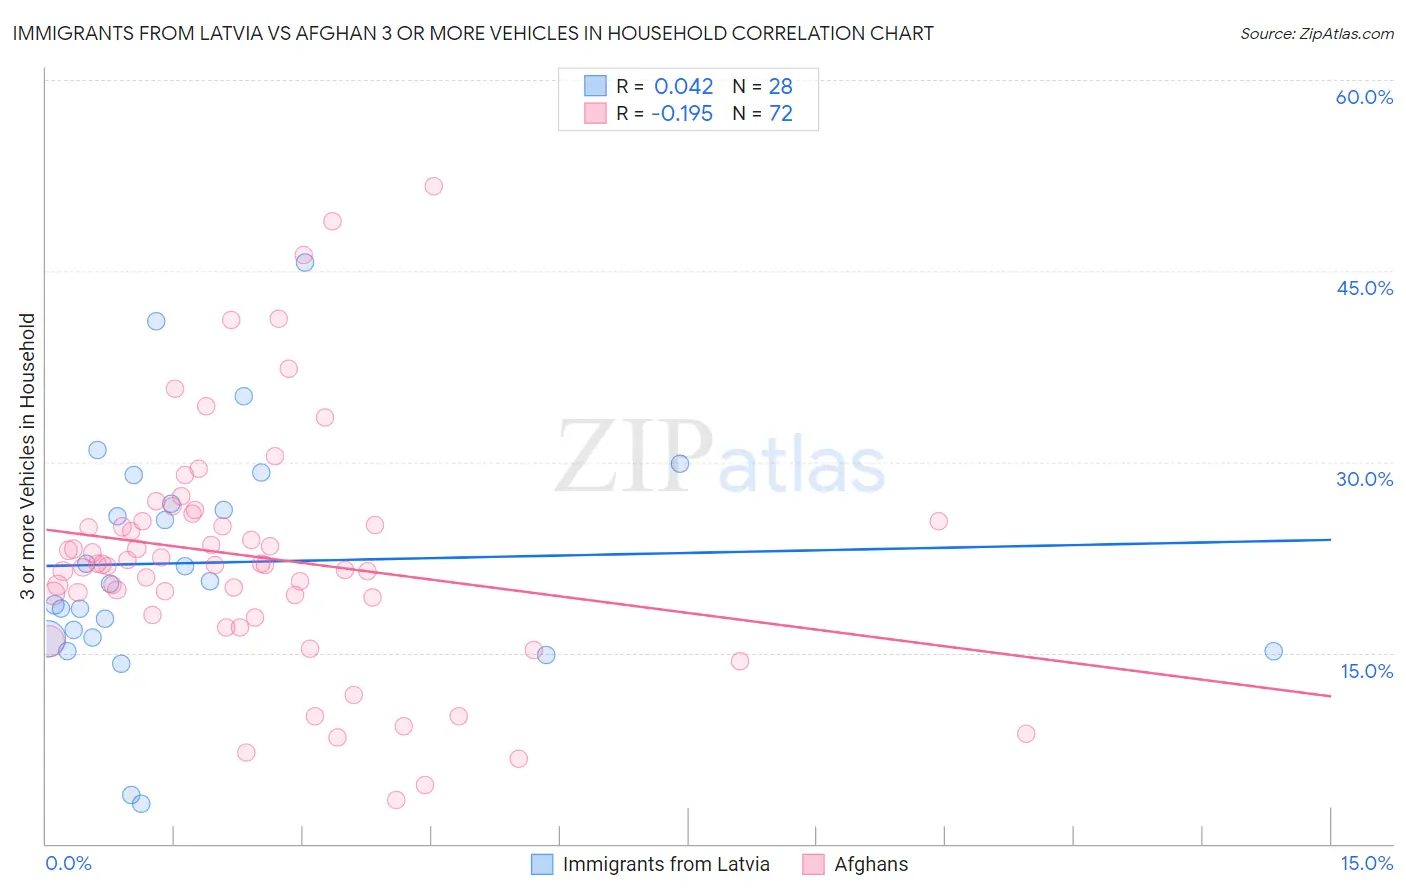
Immigrants from Latvia vs Afghan 3 or more Vehicles in Household Correlation Chart
The statistical analysis conducted on geographies consisting of 113,711,739 people shows no correlation between the proportion of Immigrants from Latvia and percentage of households with 3 or more vehicles available in the United States with a correlation coefficient (R) of 0.042 and weighted average of 17.4%. Similarly, the statistical analysis conducted on geographies consisting of 148,806,002 people shows a poor negative correlation between the proportion of Afghans and percentage of households with 3 or more vehicles available in the United States with a correlation coefficient (R) of -0.195 and weighted average of 21.7%, a difference of 24.7%.
3 or more Vehicles in Household Correlation Summary
| Measurement | Immigrants from Latvia | Afghan |
| Minimum | 3.1% | 3.4% |
| Maximum | 45.7% | 51.7% |
| Range | 42.6% | 48.3% |
| Mean | 22.1% | 22.5% |
| Median | 20.5% | 21.9% |
| Interquartile 25% (IQ1) | 16.1% | 18.6% |
| Interquartile 75% (IQ3) | 27.9% | 25.3% |
| Interquartile Range (IQR) | 11.7% | 6.7% |
| Standard Deviation (Sample) | 9.5% | 9.4% |
| Standard Deviation (Population) | 9.4% | 9.4% |
Similar Demographics by 3 or more Vehicles in Household
Demographics Similar to Immigrants from Latvia by 3 or more Vehicles in Household
In terms of 3 or more vehicles in household, the demographic groups most similar to Immigrants from Latvia are Immigrants from Eastern Europe (17.4%, a difference of 0.040%), Immigrants from Kazakhstan (17.4%, a difference of 0.080%), Immigrants from Bahamas (17.4%, a difference of 0.10%), Brazilian (17.4%, a difference of 0.19%), and Immigrants from Ireland (17.3%, a difference of 0.29%).
| Demographics | Rating | Rank | 3 or more Vehicles in Household |
| Immigrants | Bosnia and Herzegovina | 0.5 /100 | #274 | Tragic 17.5% |
| Immigrants | Ukraine | 0.4 /100 | #275 | Tragic 17.5% |
| Okinawans | 0.4 /100 | #276 | Tragic 17.4% |
| Brazilians | 0.4 /100 | #277 | Tragic 17.4% |
| Immigrants | Bahamas | 0.3 /100 | #278 | Tragic 17.4% |
| Immigrants | Kazakhstan | 0.3 /100 | #279 | Tragic 17.4% |
| Immigrants | Eastern Europe | 0.3 /100 | #280 | Tragic 17.4% |
| Immigrants | Latvia | 0.3 /100 | #281 | Tragic 17.4% |
| Immigrants | Ireland | 0.3 /100 | #282 | Tragic 17.3% |
| Blacks/African Americans | 0.3 /100 | #283 | Tragic 17.3% |
| Immigrants | Colombia | 0.3 /100 | #284 | Tragic 17.3% |
| Immigrants | Croatia | 0.2 /100 | #285 | Tragic 17.2% |
| Menominee | 0.2 /100 | #286 | Tragic 17.2% |
| Immigrants | Brazil | 0.2 /100 | #287 | Tragic 17.1% |
| Immigrants | Uruguay | 0.2 /100 | #288 | Tragic 17.1% |
Demographics Similar to Afghans by 3 or more Vehicles in Household
In terms of 3 or more vehicles in household, the demographic groups most similar to Afghans are Celtic (21.7%, a difference of 0.070%), Assyrian/Chaldean/Syriac (21.7%, a difference of 0.20%), Czechoslovakian (21.7%, a difference of 0.21%), Irish (21.8%, a difference of 0.34%), and Nonimmigrants (21.8%, a difference of 0.41%).
| Demographics | Rating | Rank | 3 or more Vehicles in Household |
| Salvadorans | 99.8 /100 | #73 | Exceptional 21.8% |
| Immigrants | Oceania | 99.8 /100 | #74 | Exceptional 21.8% |
| Japanese | 99.8 /100 | #75 | Exceptional 21.8% |
| Immigrants | Nonimmigrants | 99.8 /100 | #76 | Exceptional 21.8% |
| Irish | 99.8 /100 | #77 | Exceptional 21.8% |
| Czechoslovakians | 99.8 /100 | #78 | Exceptional 21.7% |
| Assyrians/Chaldeans/Syriacs | 99.8 /100 | #79 | Exceptional 21.7% |
| Afghans | 99.7 /100 | #80 | Exceptional 21.7% |
| Celtics | 99.7 /100 | #81 | Exceptional 21.7% |
| Immigrants | El Salvador | 99.6 /100 | #82 | Exceptional 21.5% |
| Chippewa | 99.6 /100 | #83 | Exceptional 21.5% |
| Icelanders | 99.6 /100 | #84 | Exceptional 21.5% |
| Laotians | 99.6 /100 | #85 | Exceptional 21.5% |
| Delaware | 99.6 /100 | #86 | Exceptional 21.5% |
| Immigrants | Azores | 99.5 /100 | #87 | Exceptional 21.5% |