Immigrants from Latvia vs Immigrants from South Central Asia 3 or more Vehicles in Household
COMPARE
Immigrants from Latvia
Immigrants from South Central Asia
3 or more Vehicles in Household
3 or more Vehicles in Household Comparison
Immigrants from Latvia
Immigrants from South Central Asia
17.4%
3 OR MORE VEHICLES IN HOUSEHOLD
0.3/ 100
METRIC RATING
281st/ 347
METRIC RANK
19.3%
3 OR MORE VEHICLES IN HOUSEHOLD
38.9/ 100
METRIC RATING
179th/ 347
METRIC RANK
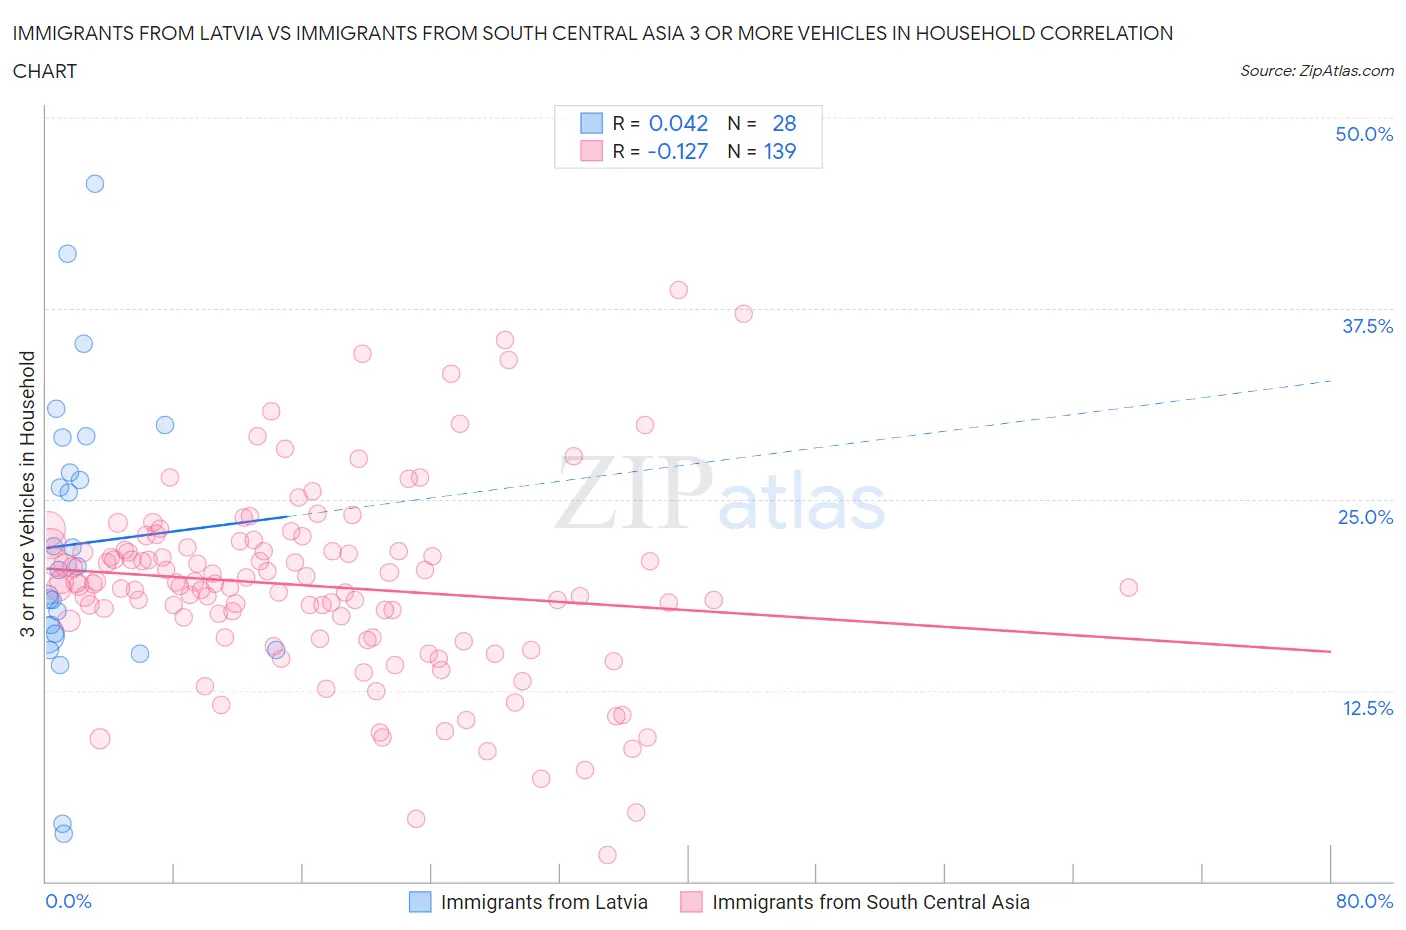
Immigrants from Latvia vs Immigrants from South Central Asia 3 or more Vehicles in Household Correlation Chart
The statistical analysis conducted on geographies consisting of 113,711,739 people shows no correlation between the proportion of Immigrants from Latvia and percentage of households with 3 or more vehicles available in the United States with a correlation coefficient (R) of 0.042 and weighted average of 17.4%. Similarly, the statistical analysis conducted on geographies consisting of 472,461,759 people shows a poor negative correlation between the proportion of Immigrants from South Central Asia and percentage of households with 3 or more vehicles available in the United States with a correlation coefficient (R) of -0.127 and weighted average of 19.3%, a difference of 11.2%.
3 or more Vehicles in Household Correlation Summary
| Measurement | Immigrants from Latvia | Immigrants from South Central Asia |
| Minimum | 3.1% | 1.7% |
| Maximum | 45.7% | 38.7% |
| Range | 42.6% | 37.0% |
| Mean | 22.1% | 19.3% |
| Median | 20.5% | 19.5% |
| Interquartile 25% (IQ1) | 16.1% | 15.9% |
| Interquartile 75% (IQ3) | 27.9% | 21.7% |
| Interquartile Range (IQR) | 11.7% | 5.8% |
| Standard Deviation (Sample) | 9.5% | 6.3% |
| Standard Deviation (Population) | 9.4% | 6.2% |
Similar Demographics by 3 or more Vehicles in Household
Demographics Similar to Immigrants from Latvia by 3 or more Vehicles in Household
In terms of 3 or more vehicles in household, the demographic groups most similar to Immigrants from Latvia are Immigrants from Eastern Europe (17.4%, a difference of 0.040%), Immigrants from Kazakhstan (17.4%, a difference of 0.080%), Immigrants from Bahamas (17.4%, a difference of 0.10%), Brazilian (17.4%, a difference of 0.19%), and Immigrants from Ireland (17.3%, a difference of 0.29%).
| Demographics | Rating | Rank | 3 or more Vehicles in Household |
| Immigrants | Bosnia and Herzegovina | 0.5 /100 | #274 | Tragic 17.5% |
| Immigrants | Ukraine | 0.4 /100 | #275 | Tragic 17.5% |
| Okinawans | 0.4 /100 | #276 | Tragic 17.4% |
| Brazilians | 0.4 /100 | #277 | Tragic 17.4% |
| Immigrants | Bahamas | 0.3 /100 | #278 | Tragic 17.4% |
| Immigrants | Kazakhstan | 0.3 /100 | #279 | Tragic 17.4% |
| Immigrants | Eastern Europe | 0.3 /100 | #280 | Tragic 17.4% |
| Immigrants | Latvia | 0.3 /100 | #281 | Tragic 17.4% |
| Immigrants | Ireland | 0.3 /100 | #282 | Tragic 17.3% |
| Blacks/African Americans | 0.3 /100 | #283 | Tragic 17.3% |
| Immigrants | Colombia | 0.3 /100 | #284 | Tragic 17.3% |
| Immigrants | Croatia | 0.2 /100 | #285 | Tragic 17.2% |
| Menominee | 0.2 /100 | #286 | Tragic 17.2% |
| Immigrants | Brazil | 0.2 /100 | #287 | Tragic 17.1% |
| Immigrants | Uruguay | 0.2 /100 | #288 | Tragic 17.1% |
Demographics Similar to Immigrants from South Central Asia by 3 or more Vehicles in Household
In terms of 3 or more vehicles in household, the demographic groups most similar to Immigrants from South Central Asia are Immigrants from Syria (19.4%, a difference of 0.11%), South African (19.3%, a difference of 0.11%), Romanian (19.3%, a difference of 0.15%), Immigrants from Peru (19.4%, a difference of 0.17%), and Cuban (19.3%, a difference of 0.19%).
| Demographics | Rating | Rank | 3 or more Vehicles in Household |
| Kiowa | 50.9 /100 | #172 | Average 19.5% |
| Immigrants | Northern Europe | 50.2 /100 | #173 | Average 19.5% |
| Immigrants | South Africa | 50.0 /100 | #174 | Average 19.5% |
| Syrians | 47.0 /100 | #175 | Average 19.5% |
| Iroquois | 46.0 /100 | #176 | Average 19.4% |
| Immigrants | Peru | 41.1 /100 | #177 | Average 19.4% |
| Immigrants | Syria | 40.3 /100 | #178 | Average 19.4% |
| Immigrants | South Central Asia | 38.9 /100 | #179 | Fair 19.3% |
| South Africans | 37.5 /100 | #180 | Fair 19.3% |
| Romanians | 37.1 /100 | #181 | Fair 19.3% |
| Cubans | 36.6 /100 | #182 | Fair 19.3% |
| Cajuns | 36.0 /100 | #183 | Fair 19.3% |
| Latvians | 35.7 /100 | #184 | Fair 19.3% |
| Immigrants | Sri Lanka | 30.7 /100 | #185 | Fair 19.2% |
| Immigrants | Sweden | 29.0 /100 | #186 | Fair 19.2% |