Immigrants from Latvia vs English 3 or more Vehicles in Household
COMPARE
Immigrants from Latvia
English
3 or more Vehicles in Household
3 or more Vehicles in Household Comparison
Immigrants from Latvia
English
17.4%
3 OR MORE VEHICLES IN HOUSEHOLD
0.3/ 100
METRIC RATING
281st/ 347
METRIC RANK
23.1%
3 OR MORE VEHICLES IN HOUSEHOLD
100.0/ 100
METRIC RATING
31st/ 347
METRIC RANK
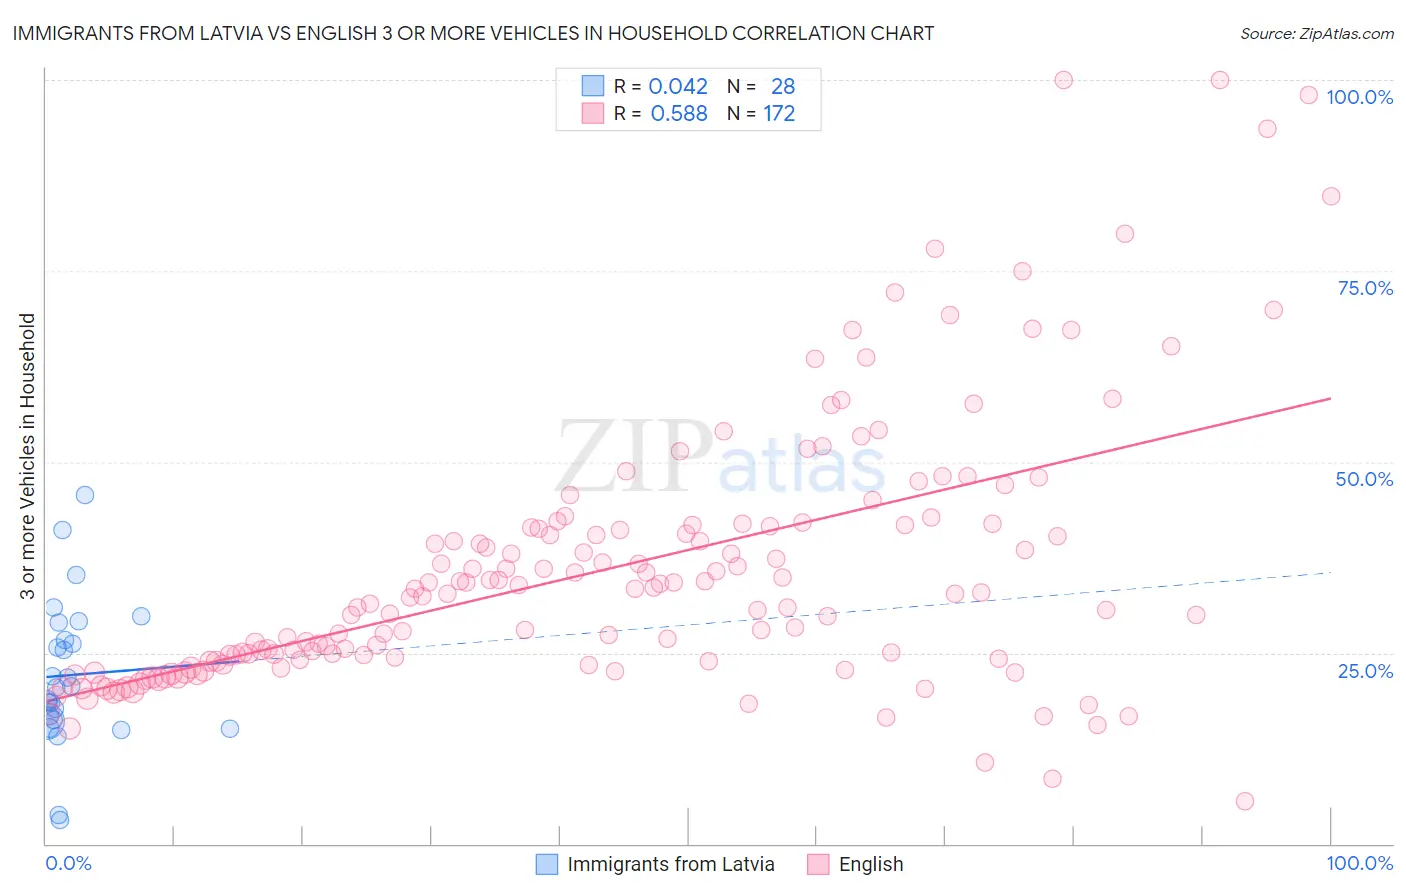
Immigrants from Latvia vs English 3 or more Vehicles in Household Correlation Chart
The statistical analysis conducted on geographies consisting of 113,711,739 people shows no correlation between the proportion of Immigrants from Latvia and percentage of households with 3 or more vehicles available in the United States with a correlation coefficient (R) of 0.042 and weighted average of 17.4%. Similarly, the statistical analysis conducted on geographies consisting of 578,919,458 people shows a substantial positive correlation between the proportion of English and percentage of households with 3 or more vehicles available in the United States with a correlation coefficient (R) of 0.588 and weighted average of 23.1%, a difference of 32.6%.
3 or more Vehicles in Household Correlation Summary
| Measurement | Immigrants from Latvia | English |
| Minimum | 3.1% | 5.6% |
| Maximum | 45.7% | 100.0% |
| Range | 42.6% | 94.4% |
| Mean | 22.1% | 36.0% |
| Median | 20.5% | 32.8% |
| Interquartile 25% (IQ1) | 16.1% | 23.9% |
| Interquartile 75% (IQ3) | 27.9% | 41.7% |
| Interquartile Range (IQR) | 11.7% | 17.7% |
| Standard Deviation (Sample) | 9.5% | 17.5% |
| Standard Deviation (Population) | 9.4% | 17.5% |
Similar Demographics by 3 or more Vehicles in Household
Demographics Similar to Immigrants from Latvia by 3 or more Vehicles in Household
In terms of 3 or more vehicles in household, the demographic groups most similar to Immigrants from Latvia are Immigrants from Eastern Europe (17.4%, a difference of 0.040%), Immigrants from Kazakhstan (17.4%, a difference of 0.080%), Immigrants from Bahamas (17.4%, a difference of 0.10%), Brazilian (17.4%, a difference of 0.19%), and Immigrants from Ireland (17.3%, a difference of 0.29%).
| Demographics | Rating | Rank | 3 or more Vehicles in Household |
| Immigrants | Bosnia and Herzegovina | 0.5 /100 | #274 | Tragic 17.5% |
| Immigrants | Ukraine | 0.4 /100 | #275 | Tragic 17.5% |
| Okinawans | 0.4 /100 | #276 | Tragic 17.4% |
| Brazilians | 0.4 /100 | #277 | Tragic 17.4% |
| Immigrants | Bahamas | 0.3 /100 | #278 | Tragic 17.4% |
| Immigrants | Kazakhstan | 0.3 /100 | #279 | Tragic 17.4% |
| Immigrants | Eastern Europe | 0.3 /100 | #280 | Tragic 17.4% |
| Immigrants | Latvia | 0.3 /100 | #281 | Tragic 17.4% |
| Immigrants | Ireland | 0.3 /100 | #282 | Tragic 17.3% |
| Blacks/African Americans | 0.3 /100 | #283 | Tragic 17.3% |
| Immigrants | Colombia | 0.3 /100 | #284 | Tragic 17.3% |
| Immigrants | Croatia | 0.2 /100 | #285 | Tragic 17.2% |
| Menominee | 0.2 /100 | #286 | Tragic 17.2% |
| Immigrants | Brazil | 0.2 /100 | #287 | Tragic 17.1% |
| Immigrants | Uruguay | 0.2 /100 | #288 | Tragic 17.1% |
Demographics Similar to English by 3 or more Vehicles in Household
In terms of 3 or more vehicles in household, the demographic groups most similar to English are Pueblo (23.0%, a difference of 0.090%), Spanish American (23.0%, a difference of 0.15%), Immigrants from South Eastern Asia (23.1%, a difference of 0.19%), Swiss (23.0%, a difference of 0.20%), and Choctaw (23.0%, a difference of 0.22%).
| Demographics | Rating | Rank | 3 or more Vehicles in Household |
| Sri Lankans | 100.0 /100 | #24 | Exceptional 23.6% |
| Immigrants | Central America | 100.0 /100 | #25 | Exceptional 23.4% |
| Mexican American Indians | 100.0 /100 | #26 | Exceptional 23.3% |
| Guamanians/Chamorros | 100.0 /100 | #27 | Exceptional 23.2% |
| Lumbee | 100.0 /100 | #28 | Exceptional 23.1% |
| Spanish | 100.0 /100 | #29 | Exceptional 23.1% |
| Immigrants | South Eastern Asia | 100.0 /100 | #30 | Exceptional 23.1% |
| English | 100.0 /100 | #31 | Exceptional 23.1% |
| Pueblo | 100.0 /100 | #32 | Exceptional 23.0% |
| Spanish Americans | 100.0 /100 | #33 | Exceptional 23.0% |
| Swiss | 100.0 /100 | #34 | Exceptional 23.0% |
| Choctaw | 100.0 /100 | #35 | Exceptional 23.0% |
| Cherokee | 100.0 /100 | #36 | Exceptional 23.0% |
| Swedes | 100.0 /100 | #37 | Exceptional 23.0% |
| Dutch | 100.0 /100 | #38 | Exceptional 22.9% |