Immigrants from Belarus vs Armenian 2 or more Vehicles in Household
COMPARE
Immigrants from Belarus
Armenian
2 or more Vehicles in Household
2 or more Vehicles in Household Comparison
Immigrants from Belarus
Armenians
47.9%
2 OR MORE VEHICLES IN HOUSEHOLD
0.0/ 100
METRIC RATING
311th/ 347
METRIC RANK
56.3%
2 OR MORE VEHICLES IN HOUSEHOLD
84.3/ 100
METRIC RATING
139th/ 347
METRIC RANK
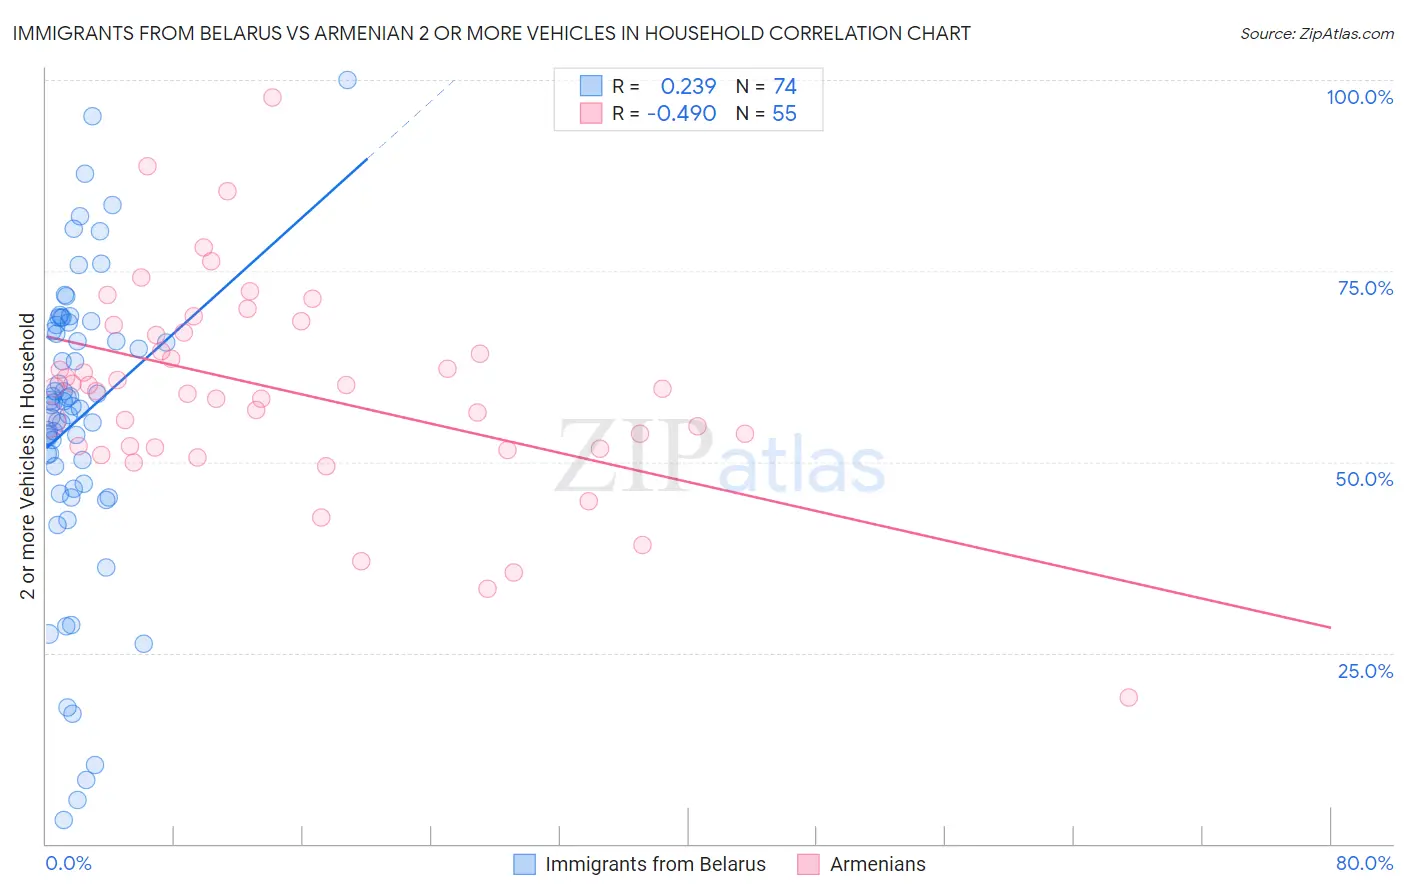
Immigrants from Belarus vs Armenian 2 or more Vehicles in Household Correlation Chart
The statistical analysis conducted on geographies consisting of 150,189,140 people shows a weak positive correlation between the proportion of Immigrants from Belarus and percentage of households with 2 or more vehicles available in the United States with a correlation coefficient (R) of 0.239 and weighted average of 47.9%. Similarly, the statistical analysis conducted on geographies consisting of 310,821,659 people shows a moderate negative correlation between the proportion of Armenians and percentage of households with 2 or more vehicles available in the United States with a correlation coefficient (R) of -0.490 and weighted average of 56.3%, a difference of 17.4%.
2 or more Vehicles in Household Correlation Summary
| Measurement | Immigrants from Belarus | Armenian |
| Minimum | 3.0% | 19.2% |
| Maximum | 100.0% | 97.7% |
| Range | 97.0% | 78.5% |
| Mean | 55.5% | 59.2% |
| Median | 57.6% | 59.5% |
| Interquartile 25% (IQ1) | 47.1% | 51.9% |
| Interquartile 75% (IQ3) | 67.9% | 67.0% |
| Interquartile Range (IQR) | 20.9% | 15.1% |
| Standard Deviation (Sample) | 19.6% | 13.6% |
| Standard Deviation (Population) | 19.4% | 13.4% |
Similar Demographics by 2 or more Vehicles in Household
Demographics Similar to Immigrants from Belarus by 2 or more Vehicles in Household
In terms of 2 or more vehicles in household, the demographic groups most similar to Immigrants from Belarus are Ghanaian (48.0%, a difference of 0.12%), Haitian (47.6%, a difference of 0.74%), U.S. Virgin Islander (47.5%, a difference of 0.91%), Immigrants from Ghana (47.4%, a difference of 1.1%), and Puerto Rican (47.1%, a difference of 1.7%).
| Demographics | Rating | Rank | 2 or more Vehicles in Household |
| Immigrants | Belize | 0.0 /100 | #304 | Tragic 49.9% |
| Immigrants | Western Africa | 0.0 /100 | #305 | Tragic 49.4% |
| Immigrants | Israel | 0.0 /100 | #306 | Tragic 49.2% |
| Hopi | 0.0 /100 | #307 | Tragic 49.0% |
| Albanians | 0.0 /100 | #308 | Tragic 49.0% |
| Moroccans | 0.0 /100 | #309 | Tragic 48.8% |
| Ghanaians | 0.0 /100 | #310 | Tragic 48.0% |
| Immigrants | Belarus | 0.0 /100 | #311 | Tragic 47.9% |
| Haitians | 0.0 /100 | #312 | Tragic 47.6% |
| U.S. Virgin Islanders | 0.0 /100 | #313 | Tragic 47.5% |
| Immigrants | Ghana | 0.0 /100 | #314 | Tragic 47.4% |
| Puerto Ricans | 0.0 /100 | #315 | Tragic 47.1% |
| Cape Verdeans | 0.0 /100 | #316 | Tragic 46.8% |
| Immigrants | Haiti | 0.0 /100 | #317 | Tragic 46.5% |
| Immigrants | Albania | 0.0 /100 | #318 | Tragic 46.0% |
Demographics Similar to Armenians by 2 or more Vehicles in Household
In terms of 2 or more vehicles in household, the demographic groups most similar to Armenians are Salvadoran (56.3%, a difference of 0.030%), Cuban (56.3%, a difference of 0.040%), Latvian (56.2%, a difference of 0.050%), Immigrants from Cambodia (56.2%, a difference of 0.050%), and South African (56.2%, a difference of 0.090%).
| Demographics | Rating | Rank | 2 or more Vehicles in Household |
| Hungarians | 89.1 /100 | #132 | Excellent 56.5% |
| Comanche | 88.4 /100 | #133 | Excellent 56.5% |
| Immigrants | Azores | 86.6 /100 | #134 | Excellent 56.4% |
| Blackfeet | 86.5 /100 | #135 | Excellent 56.4% |
| Immigrants | Asia | 86.0 /100 | #136 | Excellent 56.3% |
| Cubans | 84.8 /100 | #137 | Excellent 56.3% |
| Salvadorans | 84.7 /100 | #138 | Excellent 56.3% |
| Armenians | 84.3 /100 | #139 | Excellent 56.3% |
| Latvians | 83.6 /100 | #140 | Excellent 56.2% |
| Immigrants | Cambodia | 83.6 /100 | #141 | Excellent 56.2% |
| South Africans | 83.1 /100 | #142 | Excellent 56.2% |
| Seminole | 81.7 /100 | #143 | Excellent 56.2% |
| Immigrants | Syria | 81.4 /100 | #144 | Excellent 56.2% |
| Syrians | 81.2 /100 | #145 | Excellent 56.2% |
| Venezuelans | 80.7 /100 | #146 | Excellent 56.1% |