Immigrants from Latvia vs Armenian Nursery School
COMPARE
Immigrants from Latvia
Armenian
Nursery School
Nursery School Comparison
Immigrants from Latvia
Armenians
98.2%
NURSERY SCHOOL
96.4/ 100
METRIC RATING
113th/ 347
METRIC RANK
97.6%
NURSERY SCHOOL
0.4/ 100
METRIC RATING
259th/ 347
METRIC RANK
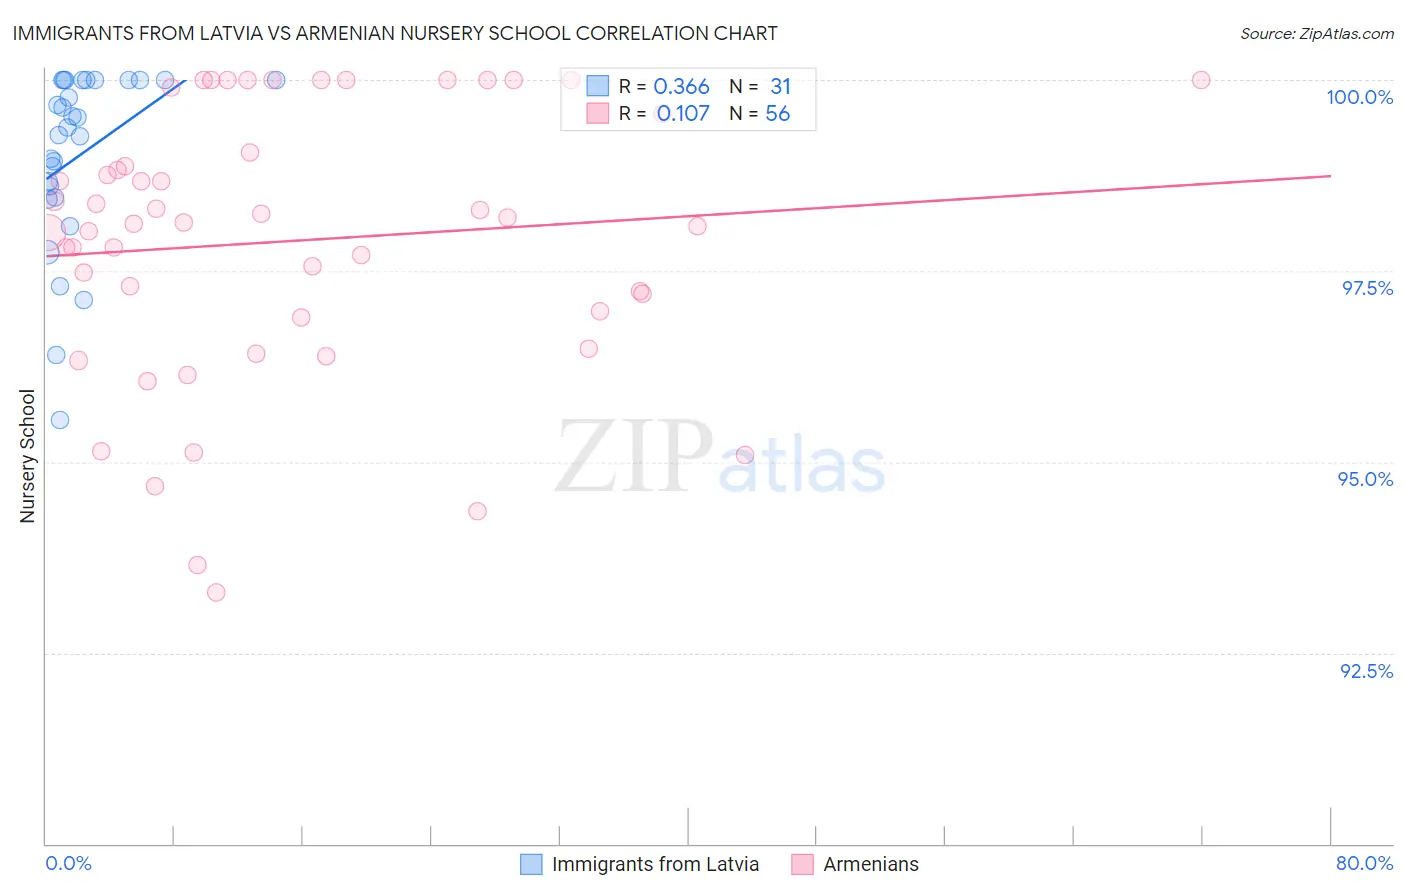
Immigrants from Latvia vs Armenian Nursery School Correlation Chart
The statistical analysis conducted on geographies consisting of 113,735,345 people shows a mild positive correlation between the proportion of Immigrants from Latvia and percentage of population with at least nursery school education in the United States with a correlation coefficient (R) of 0.366 and weighted average of 98.2%. Similarly, the statistical analysis conducted on geographies consisting of 310,954,660 people shows a poor positive correlation between the proportion of Armenians and percentage of population with at least nursery school education in the United States with a correlation coefficient (R) of 0.107 and weighted average of 97.6%, a difference of 0.66%.
Nursery School Correlation Summary
| Measurement | Immigrants from Latvia | Armenian |
| Minimum | 95.5% | 93.3% |
| Maximum | 100.0% | 100.0% |
| Range | 4.5% | 6.7% |
| Mean | 99.0% | 97.9% |
| Median | 99.4% | 98.1% |
| Interquartile 25% (IQ1) | 98.5% | 96.9% |
| Interquartile 75% (IQ3) | 100.0% | 99.3% |
| Interquartile Range (IQR) | 1.5% | 2.4% |
| Standard Deviation (Sample) | 1.2% | 1.8% |
| Standard Deviation (Population) | 1.1% | 1.7% |
Similar Demographics by Nursery School
Demographics Similar to Immigrants from Latvia by Nursery School
In terms of nursery school, the demographic groups most similar to Immigrants from Latvia are Immigrants from Norway (98.2%, a difference of 0.0%), Ute (98.2%, a difference of 0.0%), Iranian (98.2%, a difference of 0.0%), Immigrants from Singapore (98.2%, a difference of 0.010%), and Immigrants from Czechoslovakia (98.2%, a difference of 0.010%).
| Demographics | Rating | Rank | Nursery School |
| Immigrants | Switzerland | 97.3 /100 | #106 | Exceptional 98.2% |
| Basques | 97.3 /100 | #107 | Exceptional 98.2% |
| Pima | 97.1 /100 | #108 | Exceptional 98.2% |
| German Russians | 97.1 /100 | #109 | Exceptional 98.2% |
| Immigrants | Singapore | 96.9 /100 | #110 | Exceptional 98.2% |
| Immigrants | Czechoslovakia | 96.8 /100 | #111 | Exceptional 98.2% |
| Immigrants | Norway | 96.6 /100 | #112 | Exceptional 98.2% |
| Immigrants | Latvia | 96.4 /100 | #113 | Exceptional 98.2% |
| Ute | 96.4 /100 | #114 | Exceptional 98.2% |
| Iranians | 96.3 /100 | #115 | Exceptional 98.2% |
| Spanish | 95.8 /100 | #116 | Exceptional 98.2% |
| Immigrants | France | 95.6 /100 | #117 | Exceptional 98.2% |
| Yugoslavians | 95.4 /100 | #118 | Exceptional 98.2% |
| Thais | 95.0 /100 | #119 | Exceptional 98.2% |
| Okinawans | 94.5 /100 | #120 | Exceptional 98.2% |
Demographics Similar to Armenians by Nursery School
In terms of nursery school, the demographic groups most similar to Armenians are Immigrants from South America (97.6%, a difference of 0.0%), Cuban (97.6%, a difference of 0.010%), Immigrants from Ethiopia (97.6%, a difference of 0.010%), Jamaican (97.6%, a difference of 0.020%), and Fijian (97.6%, a difference of 0.020%).
| Demographics | Rating | Rank | Nursery School |
| Immigrants | Africa | 0.8 /100 | #252 | Tragic 97.6% |
| Immigrants | Iraq | 0.7 /100 | #253 | Tragic 97.6% |
| Immigrants | Congo | 0.7 /100 | #254 | Tragic 97.6% |
| Immigrants | Asia | 0.7 /100 | #255 | Tragic 97.6% |
| Yaqui | 0.6 /100 | #256 | Tragic 97.6% |
| Immigrants | Colombia | 0.6 /100 | #257 | Tragic 97.6% |
| Jamaicans | 0.6 /100 | #258 | Tragic 97.6% |
| Armenians | 0.4 /100 | #259 | Tragic 97.6% |
| Immigrants | South America | 0.4 /100 | #260 | Tragic 97.6% |
| Cubans | 0.4 /100 | #261 | Tragic 97.6% |
| Immigrants | Ethiopia | 0.4 /100 | #262 | Tragic 97.6% |
| Fijians | 0.3 /100 | #263 | Tragic 97.6% |
| Taiwanese | 0.3 /100 | #264 | Tragic 97.6% |
| Assyrians/Chaldeans/Syriacs | 0.3 /100 | #265 | Tragic 97.6% |
| Immigrants | Sierra Leone | 0.3 /100 | #266 | Tragic 97.6% |