Immigrants from Latin America vs Vietnamese 4 or more Vehicles in Household
COMPARE
Immigrants from Latin America
Vietnamese
4 or more Vehicles in Household
4 or more Vehicles in Household Comparison
Immigrants from Latin America
Vietnamese
7.1%
4 OR MORE VEHICLES IN HOUSEHOLD
99.4/ 100
METRIC RATING
92nd/ 347
METRIC RANK
3.9%
4 OR MORE VEHICLES IN HOUSEHOLD
0.0/ 100
METRIC RATING
337th/ 347
METRIC RANK
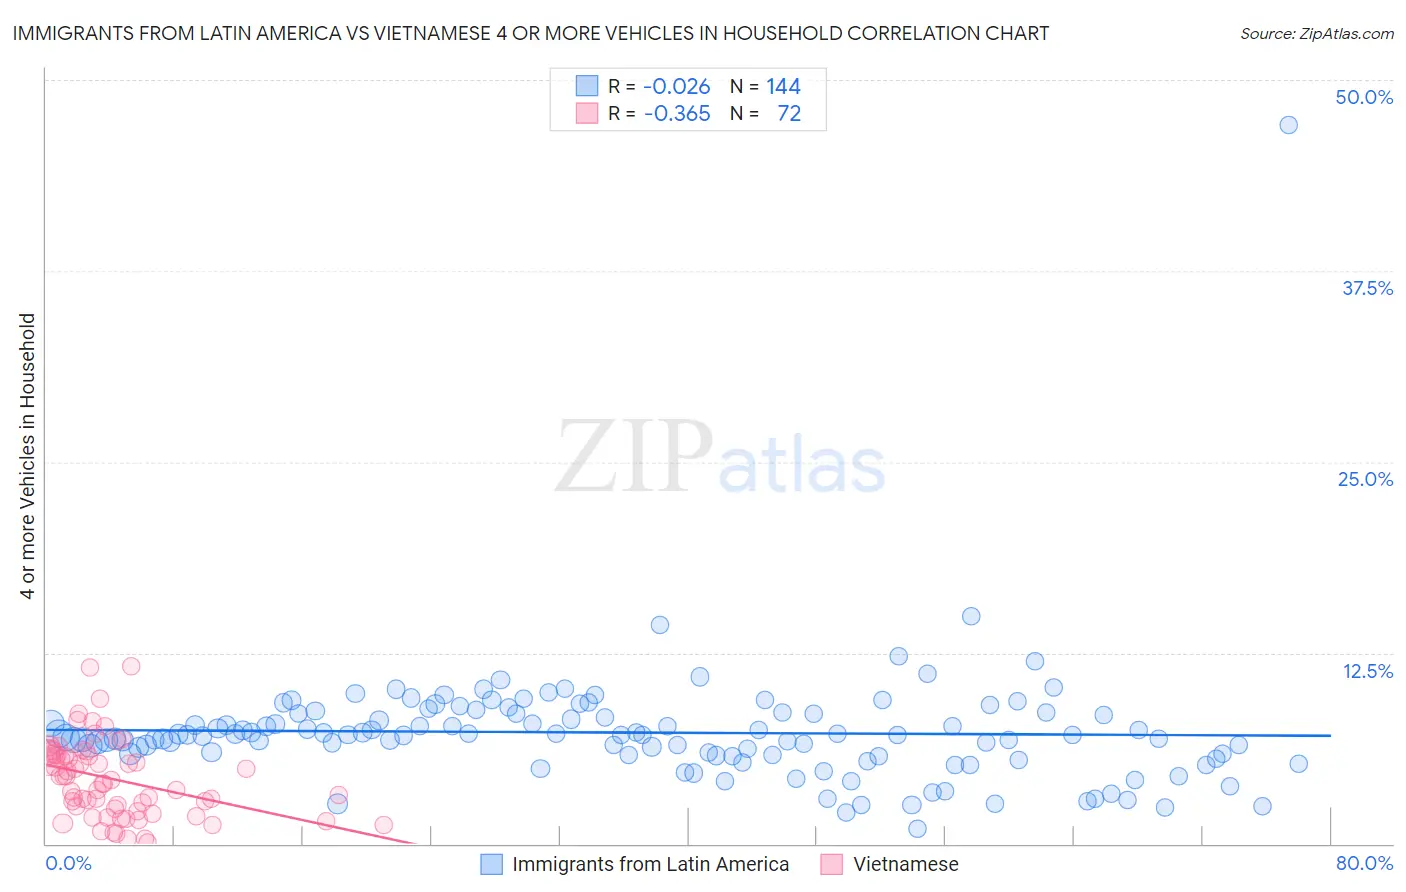
Immigrants from Latin America vs Vietnamese 4 or more Vehicles in Household Correlation Chart
The statistical analysis conducted on geographies consisting of 555,198,992 people shows no correlation between the proportion of Immigrants from Latin America and percentage of households with 4 or more vehicles available in the United States with a correlation coefficient (R) of -0.026 and weighted average of 7.1%. Similarly, the statistical analysis conducted on geographies consisting of 169,814,995 people shows a mild negative correlation between the proportion of Vietnamese and percentage of households with 4 or more vehicles available in the United States with a correlation coefficient (R) of -0.365 and weighted average of 3.9%, a difference of 84.1%.
4 or more Vehicles in Household Correlation Summary
| Measurement | Immigrants from Latin America | Vietnamese |
| Minimum | 1.0% | 0.12% |
| Maximum | 47.1% | 11.6% |
| Range | 46.0% | 11.5% |
| Mean | 7.3% | 4.2% |
| Median | 7.1% | 4.1% |
| Interquartile 25% (IQ1) | 5.8% | 2.2% |
| Interquartile 75% (IQ3) | 8.5% | 5.8% |
| Interquartile Range (IQR) | 2.8% | 3.6% |
| Standard Deviation (Sample) | 4.1% | 2.5% |
| Standard Deviation (Population) | 4.1% | 2.5% |
Similar Demographics by 4 or more Vehicles in Household
Demographics Similar to Immigrants from Latin America by 4 or more Vehicles in Household
In terms of 4 or more vehicles in household, the demographic groups most similar to Immigrants from Latin America are Assyrian/Chaldean/Syriac (7.2%, a difference of 0.16%), Immigrants from Afghanistan (7.1%, a difference of 0.17%), Dutch West Indian (7.1%, a difference of 0.18%), Czechoslovakian (7.1%, a difference of 0.39%), and Central American (7.1%, a difference of 0.41%).
| Demographics | Rating | Rank | 4 or more Vehicles in Household |
| Cree | 99.7 /100 | #85 | Exceptional 7.2% |
| Immigrants | Indonesia | 99.6 /100 | #86 | Exceptional 7.2% |
| Delaware | 99.6 /100 | #87 | Exceptional 7.2% |
| Immigrants | Nonimmigrants | 99.6 /100 | #88 | Exceptional 7.2% |
| British | 99.6 /100 | #89 | Exceptional 7.2% |
| Creek | 99.6 /100 | #90 | Exceptional 7.2% |
| Assyrians/Chaldeans/Syriacs | 99.4 /100 | #91 | Exceptional 7.2% |
| Immigrants | Latin America | 99.4 /100 | #92 | Exceptional 7.1% |
| Immigrants | Afghanistan | 99.3 /100 | #93 | Exceptional 7.1% |
| Dutch West Indians | 99.3 /100 | #94 | Exceptional 7.1% |
| Czechoslovakians | 99.3 /100 | #95 | Exceptional 7.1% |
| Central Americans | 99.3 /100 | #96 | Exceptional 7.1% |
| Celtics | 99.1 /100 | #97 | Exceptional 7.1% |
| Irish | 99.0 /100 | #98 | Exceptional 7.1% |
| Seminole | 98.8 /100 | #99 | Exceptional 7.0% |
Demographics Similar to Vietnamese by 4 or more Vehicles in Household
In terms of 4 or more vehicles in household, the demographic groups most similar to Vietnamese are Immigrants from Bangladesh (3.9%, a difference of 0.51%), Barbadian (3.9%, a difference of 0.69%), Immigrants from Cabo Verde (3.8%, a difference of 1.8%), Immigrants from Trinidad and Tobago (4.1%, a difference of 5.9%), and Immigrants from Albania (4.1%, a difference of 6.1%).
| Demographics | Rating | Rank | 4 or more Vehicles in Household |
| Immigrants | Ecuador | 0.0 /100 | #330 | Tragic 4.2% |
| West Indians | 0.0 /100 | #331 | Tragic 4.2% |
| Immigrants | Dominica | 0.0 /100 | #332 | Tragic 4.2% |
| Immigrants | Albania | 0.0 /100 | #333 | Tragic 4.1% |
| Immigrants | Trinidad and Tobago | 0.0 /100 | #334 | Tragic 4.1% |
| Barbadians | 0.0 /100 | #335 | Tragic 3.9% |
| Immigrants | Bangladesh | 0.0 /100 | #336 | Tragic 3.9% |
| Vietnamese | 0.0 /100 | #337 | Tragic 3.9% |
| Immigrants | Cabo Verde | 0.0 /100 | #338 | Tragic 3.8% |
| Immigrants | Uzbekistan | 0.0 /100 | #339 | Tragic 3.6% |
| Immigrants | Barbados | 0.0 /100 | #340 | Tragic 3.6% |
| Dominicans | 0.0 /100 | #341 | Tragic 3.5% |
| Guyanese | 0.0 /100 | #342 | Tragic 3.5% |
| British West Indians | 0.0 /100 | #343 | Tragic 3.5% |
| Immigrants | Guyana | 0.0 /100 | #344 | Tragic 3.4% |