Immigrants from Latin America vs Moroccan 4 or more Vehicles in Household
COMPARE
Immigrants from Latin America
Moroccan
4 or more Vehicles in Household
4 or more Vehicles in Household Comparison
Immigrants from Latin America
Moroccans
7.1%
4 OR MORE VEHICLES IN HOUSEHOLD
99.4/ 100
METRIC RATING
92nd/ 347
METRIC RANK
4.9%
4 OR MORE VEHICLES IN HOUSEHOLD
0.0/ 100
METRIC RATING
310th/ 347
METRIC RANK
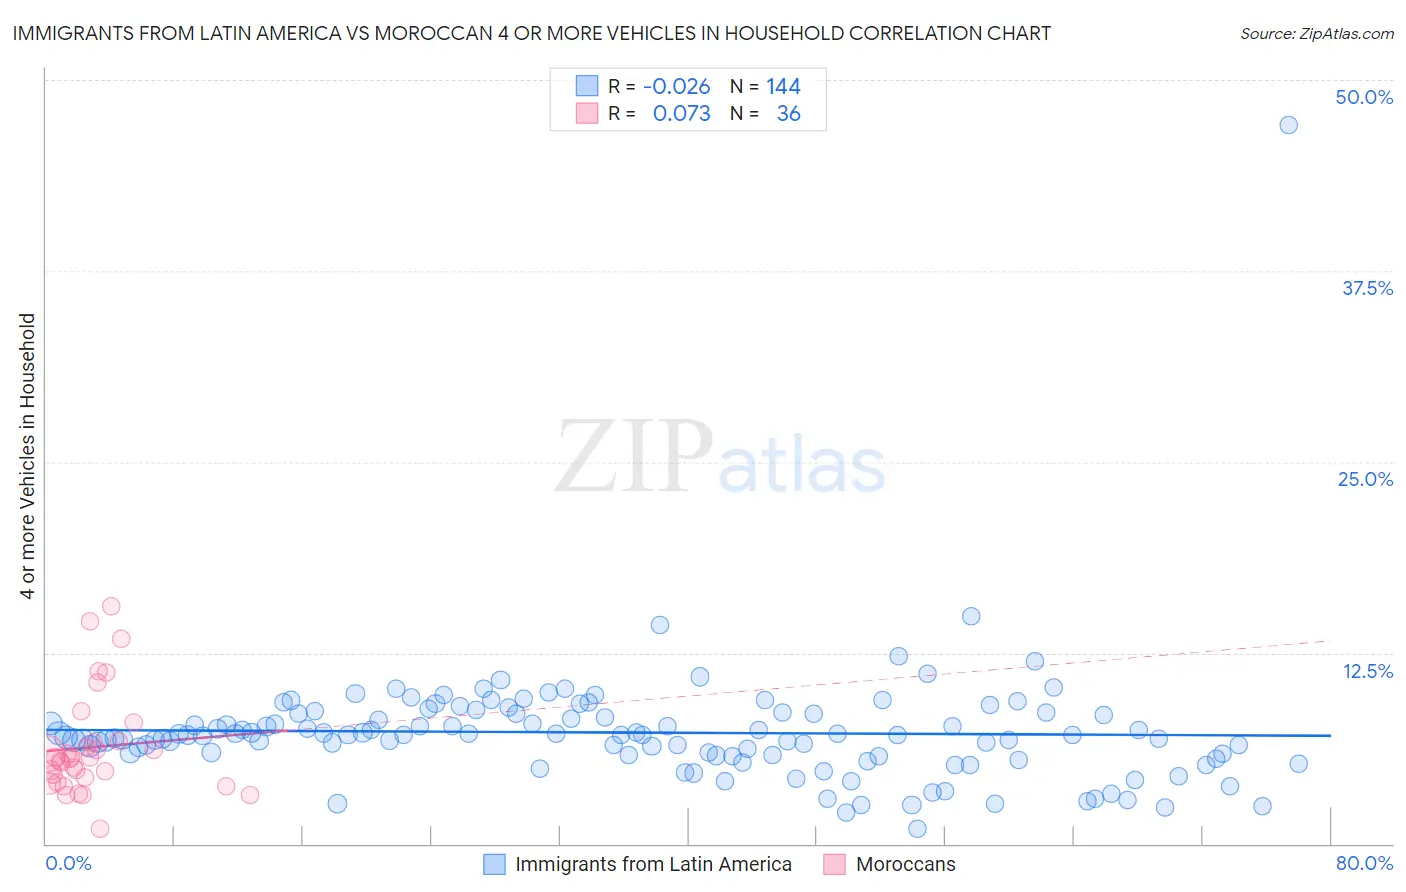
Immigrants from Latin America vs Moroccan 4 or more Vehicles in Household Correlation Chart
The statistical analysis conducted on geographies consisting of 555,198,992 people shows no correlation between the proportion of Immigrants from Latin America and percentage of households with 4 or more vehicles available in the United States with a correlation coefficient (R) of -0.026 and weighted average of 7.1%. Similarly, the statistical analysis conducted on geographies consisting of 200,763,454 people shows a slight positive correlation between the proportion of Moroccans and percentage of households with 4 or more vehicles available in the United States with a correlation coefficient (R) of 0.073 and weighted average of 4.9%, a difference of 45.4%.
4 or more Vehicles in Household Correlation Summary
| Measurement | Immigrants from Latin America | Moroccan |
| Minimum | 1.0% | 0.99% |
| Maximum | 47.1% | 15.5% |
| Range | 46.0% | 14.5% |
| Mean | 7.3% | 6.3% |
| Median | 7.1% | 5.6% |
| Interquartile 25% (IQ1) | 5.8% | 4.2% |
| Interquartile 75% (IQ3) | 8.5% | 6.7% |
| Interquartile Range (IQR) | 2.8% | 2.5% |
| Standard Deviation (Sample) | 4.1% | 3.3% |
| Standard Deviation (Population) | 4.1% | 3.3% |
Similar Demographics by 4 or more Vehicles in Household
Demographics Similar to Immigrants from Latin America by 4 or more Vehicles in Household
In terms of 4 or more vehicles in household, the demographic groups most similar to Immigrants from Latin America are Assyrian/Chaldean/Syriac (7.2%, a difference of 0.16%), Immigrants from Afghanistan (7.1%, a difference of 0.17%), Dutch West Indian (7.1%, a difference of 0.18%), Czechoslovakian (7.1%, a difference of 0.39%), and Central American (7.1%, a difference of 0.41%).
| Demographics | Rating | Rank | 4 or more Vehicles in Household |
| Cree | 99.7 /100 | #85 | Exceptional 7.2% |
| Immigrants | Indonesia | 99.6 /100 | #86 | Exceptional 7.2% |
| Delaware | 99.6 /100 | #87 | Exceptional 7.2% |
| Immigrants | Nonimmigrants | 99.6 /100 | #88 | Exceptional 7.2% |
| British | 99.6 /100 | #89 | Exceptional 7.2% |
| Creek | 99.6 /100 | #90 | Exceptional 7.2% |
| Assyrians/Chaldeans/Syriacs | 99.4 /100 | #91 | Exceptional 7.2% |
| Immigrants | Latin America | 99.4 /100 | #92 | Exceptional 7.1% |
| Immigrants | Afghanistan | 99.3 /100 | #93 | Exceptional 7.1% |
| Dutch West Indians | 99.3 /100 | #94 | Exceptional 7.1% |
| Czechoslovakians | 99.3 /100 | #95 | Exceptional 7.1% |
| Central Americans | 99.3 /100 | #96 | Exceptional 7.1% |
| Celtics | 99.1 /100 | #97 | Exceptional 7.1% |
| Irish | 99.0 /100 | #98 | Exceptional 7.1% |
| Seminole | 98.8 /100 | #99 | Exceptional 7.0% |
Demographics Similar to Moroccans by 4 or more Vehicles in Household
In terms of 4 or more vehicles in household, the demographic groups most similar to Moroccans are Houma (4.9%, a difference of 0.010%), Immigrants from Somalia (4.9%, a difference of 0.38%), Paraguayan (4.9%, a difference of 0.54%), Menominee (5.0%, a difference of 1.3%), and Immigrants from Serbia (5.0%, a difference of 2.2%).
| Demographics | Rating | Rank | 4 or more Vehicles in Household |
| Immigrants | Greece | 0.0 /100 | #303 | Tragic 5.1% |
| Cypriots | 0.0 /100 | #304 | Tragic 5.0% |
| Somalis | 0.0 /100 | #305 | Tragic 5.0% |
| Immigrants | Serbia | 0.0 /100 | #306 | Tragic 5.0% |
| Menominee | 0.0 /100 | #307 | Tragic 5.0% |
| Paraguayans | 0.0 /100 | #308 | Tragic 4.9% |
| Immigrants | Somalia | 0.0 /100 | #309 | Tragic 4.9% |
| Moroccans | 0.0 /100 | #310 | Tragic 4.9% |
| Houma | 0.0 /100 | #311 | Tragic 4.9% |
| Albanians | 0.0 /100 | #312 | Tragic 4.8% |
| Immigrants | Israel | 0.0 /100 | #313 | Tragic 4.8% |
| Immigrants | West Indies | 0.0 /100 | #314 | Tragic 4.7% |
| Immigrants | Belarus | 0.0 /100 | #315 | Tragic 4.7% |
| Puerto Ricans | 0.0 /100 | #316 | Tragic 4.7% |
| U.S. Virgin Islanders | 0.0 /100 | #317 | Tragic 4.6% |