Immigrants from Latin America vs Apache 4 or more Vehicles in Household
COMPARE
Immigrants from Latin America
Apache
4 or more Vehicles in Household
4 or more Vehicles in Household Comparison
Immigrants from Latin America
Apache
7.1%
4 OR MORE VEHICLES IN HOUSEHOLD
99.4/ 100
METRIC RATING
92nd/ 347
METRIC RANK
7.4%
4 OR MORE VEHICLES IN HOUSEHOLD
99.9/ 100
METRIC RATING
77th/ 347
METRIC RANK
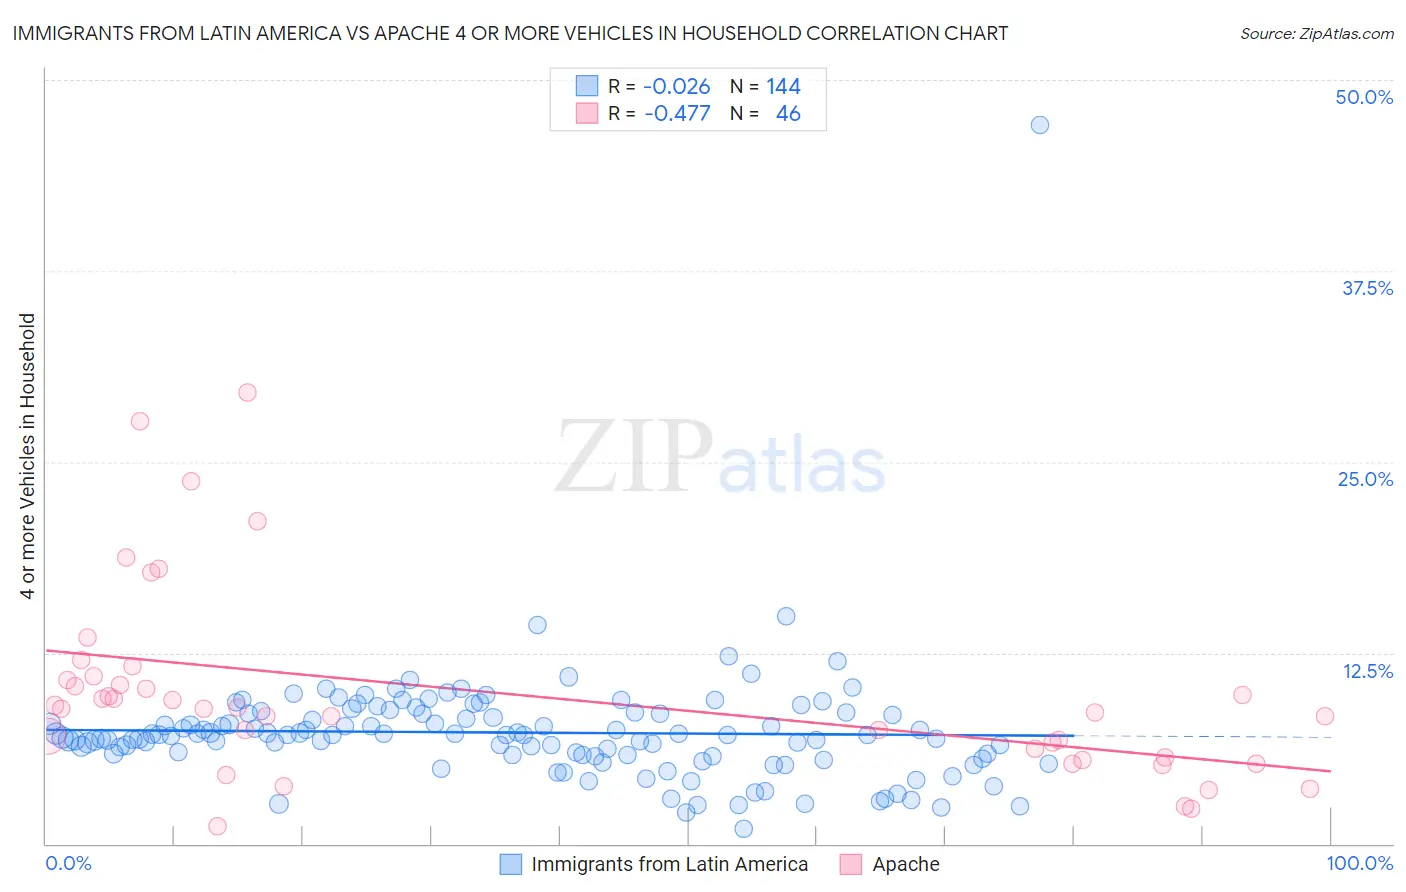
Immigrants from Latin America vs Apache 4 or more Vehicles in Household Correlation Chart
The statistical analysis conducted on geographies consisting of 555,198,992 people shows no correlation between the proportion of Immigrants from Latin America and percentage of households with 4 or more vehicles available in the United States with a correlation coefficient (R) of -0.026 and weighted average of 7.1%. Similarly, the statistical analysis conducted on geographies consisting of 230,812,683 people shows a moderate negative correlation between the proportion of Apache and percentage of households with 4 or more vehicles available in the United States with a correlation coefficient (R) of -0.477 and weighted average of 7.4%, a difference of 3.2%.
4 or more Vehicles in Household Correlation Summary
| Measurement | Immigrants from Latin America | Apache |
| Minimum | 1.0% | 1.1% |
| Maximum | 47.1% | 29.6% |
| Range | 46.0% | 28.5% |
| Mean | 7.3% | 9.8% |
| Median | 7.1% | 8.9% |
| Interquartile 25% (IQ1) | 5.8% | 5.6% |
| Interquartile 75% (IQ3) | 8.5% | 10.7% |
| Interquartile Range (IQR) | 2.8% | 5.1% |
| Standard Deviation (Sample) | 4.1% | 6.2% |
| Standard Deviation (Population) | 4.1% | 6.2% |
Demographics Similar to Immigrants from Latin America and Apache by 4 or more Vehicles in Household
In terms of 4 or more vehicles in household, the demographic groups most similar to Immigrants from Latin America are Assyrian/Chaldean/Syriac (7.2%, a difference of 0.16%), Immigrants from Afghanistan (7.1%, a difference of 0.17%), Dutch West Indian (7.1%, a difference of 0.18%), Creek (7.2%, a difference of 0.72%), and British (7.2%, a difference of 0.81%). Similarly, the demographic groups most similar to Apache are White/Caucasian (7.4%, a difference of 0.060%), Laotian (7.4%, a difference of 0.17%), Icelander (7.4%, a difference of 0.22%), Immigrants from Cambodia (7.4%, a difference of 0.22%), and Czech (7.4%, a difference of 0.24%).
| Demographics | Rating | Rank | 4 or more Vehicles in Household |
| Icelanders | 99.9 /100 | #74 | Exceptional 7.4% |
| Immigrants | Cambodia | 99.9 /100 | #75 | Exceptional 7.4% |
| Laotians | 99.9 /100 | #76 | Exceptional 7.4% |
| Apache | 99.9 /100 | #77 | Exceptional 7.4% |
| Whites/Caucasians | 99.8 /100 | #78 | Exceptional 7.4% |
| Czechs | 99.8 /100 | #79 | Exceptional 7.4% |
| Alaska Natives | 99.8 /100 | #80 | Exceptional 7.3% |
| Finns | 99.8 /100 | #81 | Exceptional 7.3% |
| Northern Europeans | 99.8 /100 | #82 | Exceptional 7.3% |
| Potawatomi | 99.7 /100 | #83 | Exceptional 7.3% |
| Afghans | 99.7 /100 | #84 | Exceptional 7.3% |
| Cree | 99.7 /100 | #85 | Exceptional 7.2% |
| Immigrants | Indonesia | 99.6 /100 | #86 | Exceptional 7.2% |
| Delaware | 99.6 /100 | #87 | Exceptional 7.2% |
| Immigrants | Nonimmigrants | 99.6 /100 | #88 | Exceptional 7.2% |
| British | 99.6 /100 | #89 | Exceptional 7.2% |
| Creek | 99.6 /100 | #90 | Exceptional 7.2% |
| Assyrians/Chaldeans/Syriacs | 99.4 /100 | #91 | Exceptional 7.2% |
| Immigrants | Latin America | 99.4 /100 | #92 | Exceptional 7.1% |
| Immigrants | Afghanistan | 99.3 /100 | #93 | Exceptional 7.1% |
| Dutch West Indians | 99.3 /100 | #94 | Exceptional 7.1% |