Immigrants from Latin America vs Laotian 4 or more Vehicles in Household
COMPARE
Immigrants from Latin America
Laotian
4 or more Vehicles in Household
4 or more Vehicles in Household Comparison
Immigrants from Latin America
Laotians
7.1%
4 OR MORE VEHICLES IN HOUSEHOLD
99.4/ 100
METRIC RATING
92nd/ 347
METRIC RANK
7.4%
4 OR MORE VEHICLES IN HOUSEHOLD
99.9/ 100
METRIC RATING
76th/ 347
METRIC RANK
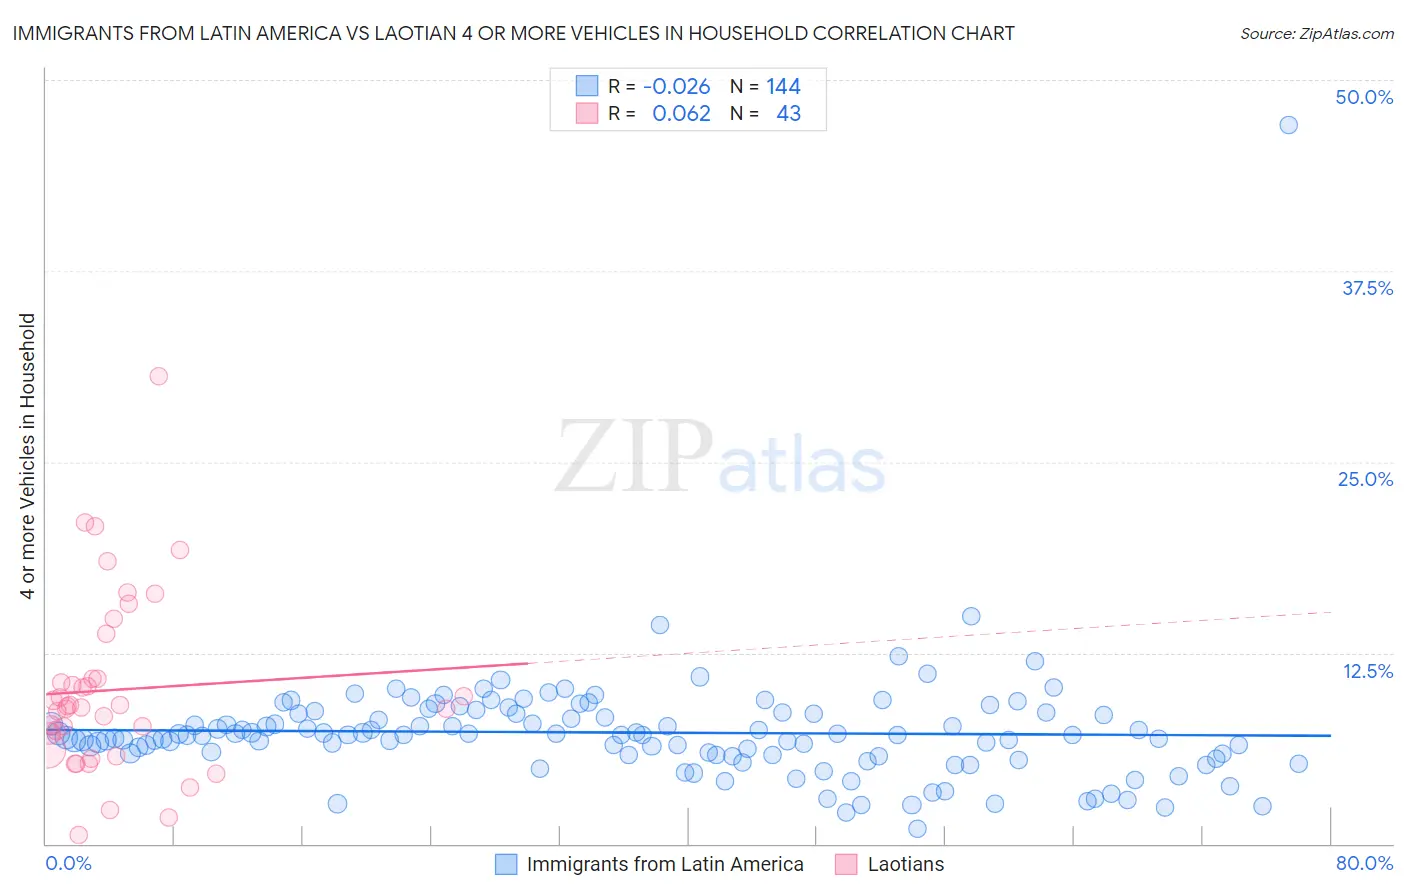
Immigrants from Latin America vs Laotian 4 or more Vehicles in Household Correlation Chart
The statistical analysis conducted on geographies consisting of 555,198,992 people shows no correlation between the proportion of Immigrants from Latin America and percentage of households with 4 or more vehicles available in the United States with a correlation coefficient (R) of -0.026 and weighted average of 7.1%. Similarly, the statistical analysis conducted on geographies consisting of 224,004,331 people shows a slight positive correlation between the proportion of Laotians and percentage of households with 4 or more vehicles available in the United States with a correlation coefficient (R) of 0.062 and weighted average of 7.4%, a difference of 3.4%.
4 or more Vehicles in Household Correlation Summary
| Measurement | Immigrants from Latin America | Laotian |
| Minimum | 1.0% | 0.54% |
| Maximum | 47.1% | 30.6% |
| Range | 46.0% | 30.1% |
| Mean | 7.3% | 10.1% |
| Median | 7.1% | 9.0% |
| Interquartile 25% (IQ1) | 5.8% | 6.1% |
| Interquartile 75% (IQ3) | 8.5% | 10.8% |
| Interquartile Range (IQR) | 2.8% | 4.7% |
| Standard Deviation (Sample) | 4.1% | 5.8% |
| Standard Deviation (Population) | 4.1% | 5.8% |
Demographics Similar to Immigrants from Latin America and Laotians by 4 or more Vehicles in Household
In terms of 4 or more vehicles in household, the demographic groups most similar to Immigrants from Latin America are Assyrian/Chaldean/Syriac (7.2%, a difference of 0.16%), Immigrants from Afghanistan (7.1%, a difference of 0.17%), Dutch West Indian (7.1%, a difference of 0.18%), Creek (7.2%, a difference of 0.72%), and British (7.2%, a difference of 0.81%). Similarly, the demographic groups most similar to Laotians are Icelander (7.4%, a difference of 0.050%), Immigrants from Cambodia (7.4%, a difference of 0.050%), Apache (7.4%, a difference of 0.17%), White/Caucasian (7.4%, a difference of 0.23%), and Czech (7.4%, a difference of 0.41%).
| Demographics | Rating | Rank | 4 or more Vehicles in Household |
| Icelanders | 99.9 /100 | #74 | Exceptional 7.4% |
| Immigrants | Cambodia | 99.9 /100 | #75 | Exceptional 7.4% |
| Laotians | 99.9 /100 | #76 | Exceptional 7.4% |
| Apache | 99.9 /100 | #77 | Exceptional 7.4% |
| Whites/Caucasians | 99.8 /100 | #78 | Exceptional 7.4% |
| Czechs | 99.8 /100 | #79 | Exceptional 7.4% |
| Alaska Natives | 99.8 /100 | #80 | Exceptional 7.3% |
| Finns | 99.8 /100 | #81 | Exceptional 7.3% |
| Northern Europeans | 99.8 /100 | #82 | Exceptional 7.3% |
| Potawatomi | 99.7 /100 | #83 | Exceptional 7.3% |
| Afghans | 99.7 /100 | #84 | Exceptional 7.3% |
| Cree | 99.7 /100 | #85 | Exceptional 7.2% |
| Immigrants | Indonesia | 99.6 /100 | #86 | Exceptional 7.2% |
| Delaware | 99.6 /100 | #87 | Exceptional 7.2% |
| Immigrants | Nonimmigrants | 99.6 /100 | #88 | Exceptional 7.2% |
| British | 99.6 /100 | #89 | Exceptional 7.2% |
| Creek | 99.6 /100 | #90 | Exceptional 7.2% |
| Assyrians/Chaldeans/Syriacs | 99.4 /100 | #91 | Exceptional 7.2% |
| Immigrants | Latin America | 99.4 /100 | #92 | Exceptional 7.1% |
| Immigrants | Afghanistan | 99.3 /100 | #93 | Exceptional 7.1% |
| Dutch West Indians | 99.3 /100 | #94 | Exceptional 7.1% |