Immigrants from Latin America vs Scotch-Irish 4 or more Vehicles in Household
COMPARE
Immigrants from Latin America
Scotch-Irish
4 or more Vehicles in Household
4 or more Vehicles in Household Comparison
Immigrants from Latin America
Scotch-Irish
7.1%
4 OR MORE VEHICLES IN HOUSEHOLD
99.4/ 100
METRIC RATING
92nd/ 347
METRIC RANK
7.4%
4 OR MORE VEHICLES IN HOUSEHOLD
99.9/ 100
METRIC RATING
72nd/ 347
METRIC RANK
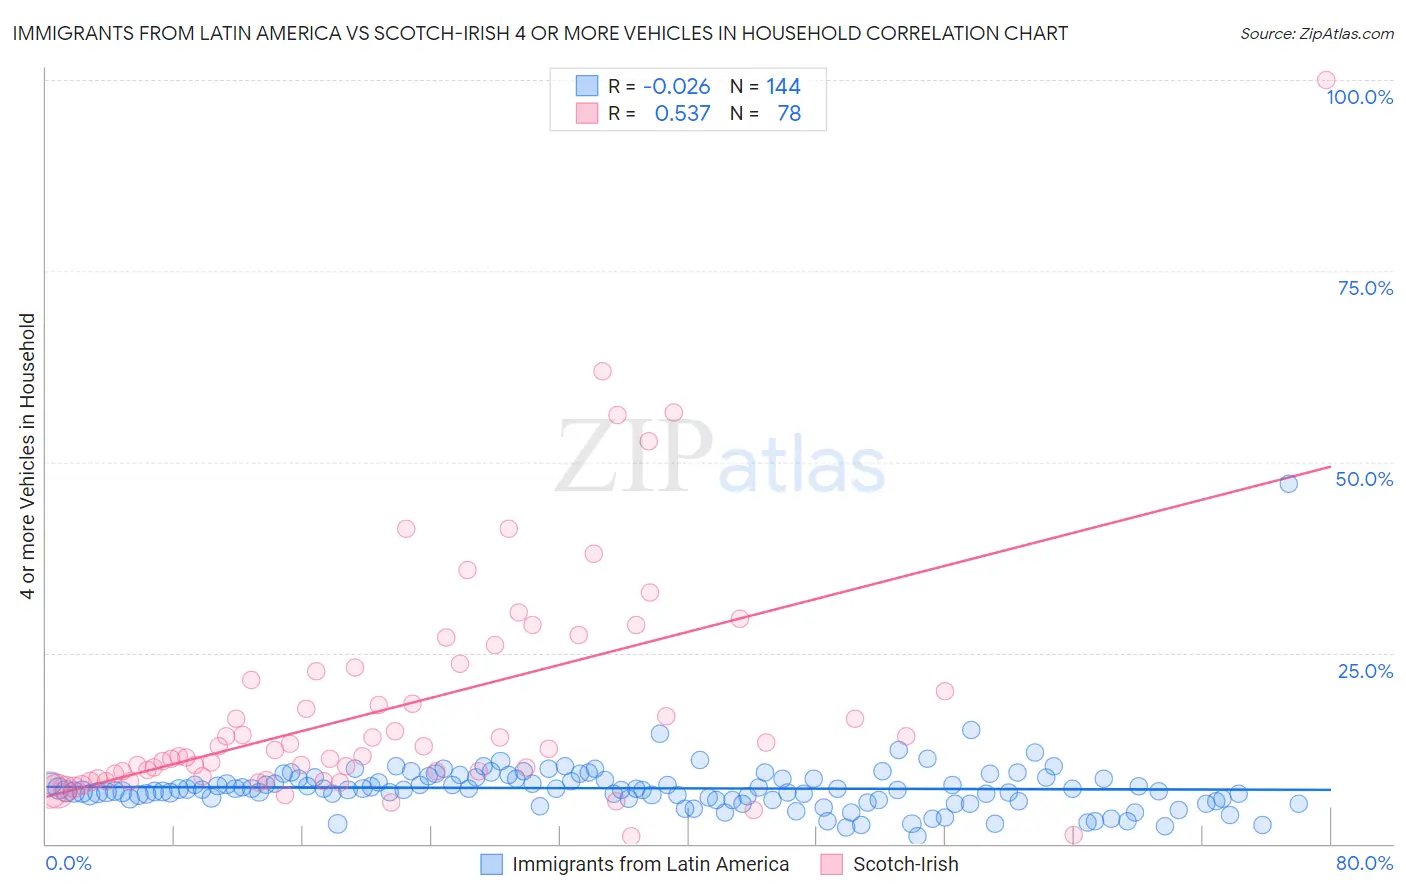
Immigrants from Latin America vs Scotch-Irish 4 or more Vehicles in Household Correlation Chart
The statistical analysis conducted on geographies consisting of 555,198,992 people shows no correlation between the proportion of Immigrants from Latin America and percentage of households with 4 or more vehicles available in the United States with a correlation coefficient (R) of -0.026 and weighted average of 7.1%. Similarly, the statistical analysis conducted on geographies consisting of 546,031,323 people shows a substantial positive correlation between the proportion of Scotch-Irish and percentage of households with 4 or more vehicles available in the United States with a correlation coefficient (R) of 0.537 and weighted average of 7.4%, a difference of 3.8%.
4 or more Vehicles in Household Correlation Summary
| Measurement | Immigrants from Latin America | Scotch-Irish |
| Minimum | 1.0% | 0.97% |
| Maximum | 47.1% | 100.0% |
| Range | 46.0% | 99.0% |
| Mean | 7.3% | 18.1% |
| Median | 7.1% | 12.4% |
| Interquartile 25% (IQ1) | 5.8% | 8.8% |
| Interquartile 75% (IQ3) | 8.5% | 22.6% |
| Interquartile Range (IQR) | 2.8% | 13.8% |
| Standard Deviation (Sample) | 4.1% | 16.0% |
| Standard Deviation (Population) | 4.1% | 15.8% |
Demographics Similar to Immigrants from Latin America and Scotch-Irish by 4 or more Vehicles in Household
In terms of 4 or more vehicles in household, the demographic groups most similar to Immigrants from Latin America are Assyrian/Chaldean/Syriac (7.2%, a difference of 0.16%), Creek (7.2%, a difference of 0.72%), British (7.2%, a difference of 0.81%), Nonimmigrants (7.2%, a difference of 1.1%), and Delaware (7.2%, a difference of 1.2%). Similarly, the demographic groups most similar to Scotch-Irish are Portuguese (7.4%, a difference of 0.090%), Icelander (7.4%, a difference of 0.39%), Immigrants from Cambodia (7.4%, a difference of 0.40%), Laotian (7.4%, a difference of 0.45%), and Apache (7.4%, a difference of 0.62%).
| Demographics | Rating | Rank | 4 or more Vehicles in Household |
| Scotch-Irish | 99.9 /100 | #72 | Exceptional 7.4% |
| Portuguese | 99.9 /100 | #73 | Exceptional 7.4% |
| Icelanders | 99.9 /100 | #74 | Exceptional 7.4% |
| Immigrants | Cambodia | 99.9 /100 | #75 | Exceptional 7.4% |
| Laotians | 99.9 /100 | #76 | Exceptional 7.4% |
| Apache | 99.9 /100 | #77 | Exceptional 7.4% |
| Whites/Caucasians | 99.8 /100 | #78 | Exceptional 7.4% |
| Czechs | 99.8 /100 | #79 | Exceptional 7.4% |
| Alaska Natives | 99.8 /100 | #80 | Exceptional 7.3% |
| Finns | 99.8 /100 | #81 | Exceptional 7.3% |
| Northern Europeans | 99.8 /100 | #82 | Exceptional 7.3% |
| Potawatomi | 99.7 /100 | #83 | Exceptional 7.3% |
| Afghans | 99.7 /100 | #84 | Exceptional 7.3% |
| Cree | 99.7 /100 | #85 | Exceptional 7.2% |
| Immigrants | Indonesia | 99.6 /100 | #86 | Exceptional 7.2% |
| Delaware | 99.6 /100 | #87 | Exceptional 7.2% |
| Immigrants | Nonimmigrants | 99.6 /100 | #88 | Exceptional 7.2% |
| British | 99.6 /100 | #89 | Exceptional 7.2% |
| Creek | 99.6 /100 | #90 | Exceptional 7.2% |
| Assyrians/Chaldeans/Syriacs | 99.4 /100 | #91 | Exceptional 7.2% |
| Immigrants | Latin America | 99.4 /100 | #92 | Exceptional 7.1% |