Immigrants from Latvia vs Vietnamese 4 or more Vehicles in Household
COMPARE
Immigrants from Latvia
Vietnamese
4 or more Vehicles in Household
4 or more Vehicles in Household Comparison
Immigrants from Latvia
Vietnamese
5.5%
4 OR MORE VEHICLES IN HOUSEHOLD
0.5/ 100
METRIC RATING
276th/ 347
METRIC RANK
3.9%
4 OR MORE VEHICLES IN HOUSEHOLD
0.0/ 100
METRIC RATING
337th/ 347
METRIC RANK
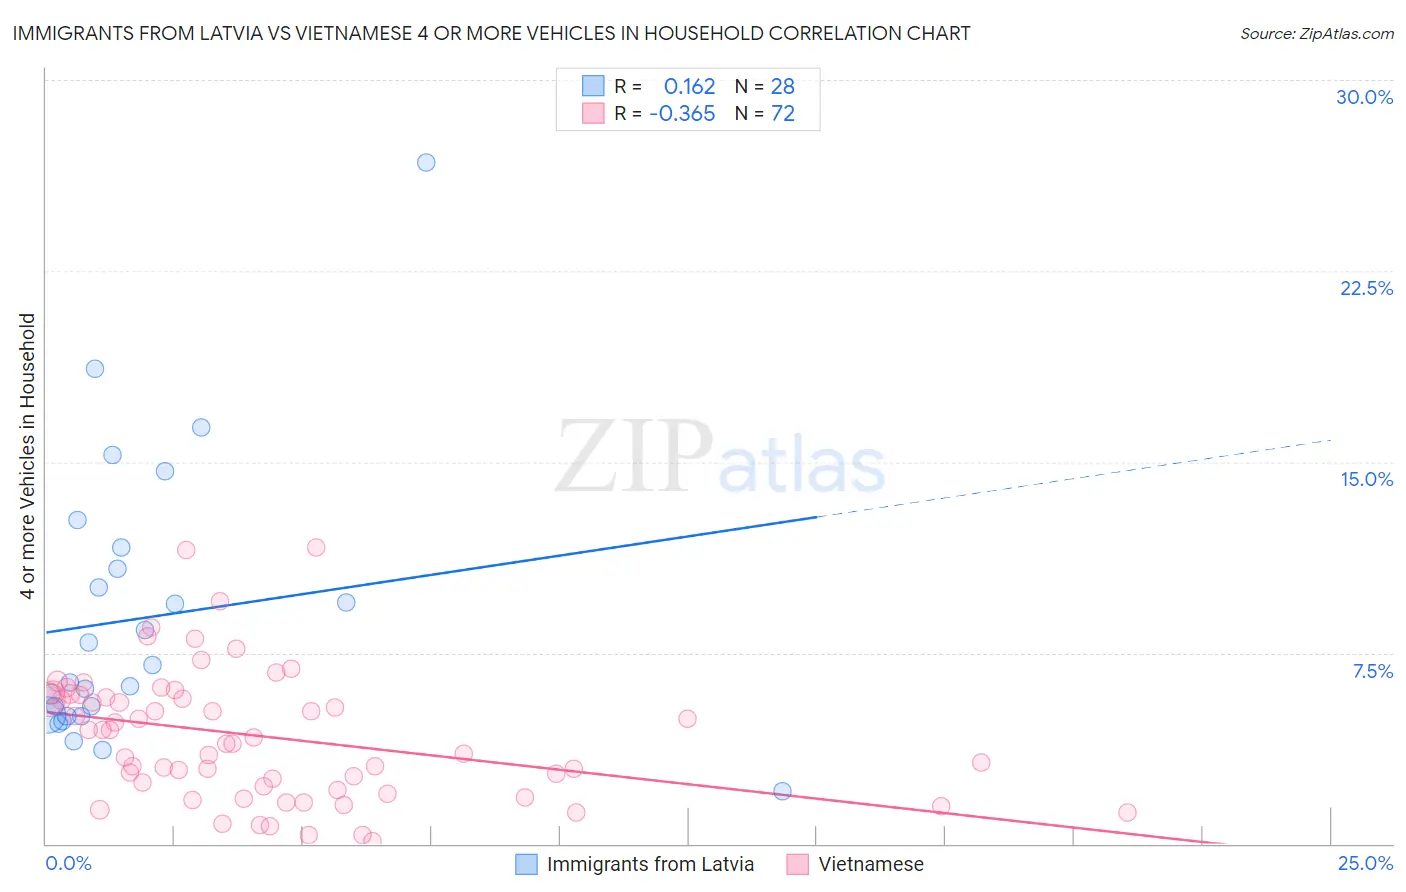
Immigrants from Latvia vs Vietnamese 4 or more Vehicles in Household Correlation Chart
The statistical analysis conducted on geographies consisting of 113,394,879 people shows a poor positive correlation between the proportion of Immigrants from Latvia and percentage of households with 4 or more vehicles available in the United States with a correlation coefficient (R) of 0.162 and weighted average of 5.5%. Similarly, the statistical analysis conducted on geographies consisting of 169,814,995 people shows a mild negative correlation between the proportion of Vietnamese and percentage of households with 4 or more vehicles available in the United States with a correlation coefficient (R) of -0.365 and weighted average of 3.9%, a difference of 41.5%.
4 or more Vehicles in Household Correlation Summary
| Measurement | Immigrants from Latvia | Vietnamese |
| Minimum | 2.0% | 0.12% |
| Maximum | 26.8% | 11.6% |
| Range | 24.7% | 11.5% |
| Mean | 8.9% | 4.2% |
| Median | 6.7% | 4.1% |
| Interquartile 25% (IQ1) | 5.0% | 2.2% |
| Interquartile 75% (IQ3) | 11.2% | 5.8% |
| Interquartile Range (IQR) | 6.2% | 3.6% |
| Standard Deviation (Sample) | 5.5% | 2.5% |
| Standard Deviation (Population) | 5.4% | 2.5% |
Similar Demographics by 4 or more Vehicles in Household
Demographics Similar to Immigrants from Latvia by 4 or more Vehicles in Household
In terms of 4 or more vehicles in household, the demographic groups most similar to Immigrants from Latvia are Cambodian (5.5%, a difference of 0.010%), Immigrants from Bulgaria (5.5%, a difference of 0.12%), Black/African American (5.5%, a difference of 0.13%), Macedonian (5.5%, a difference of 0.25%), and Immigrants from Kazakhstan (5.5%, a difference of 0.28%).
| Demographics | Rating | Rank | 4 or more Vehicles in Household |
| Carpatho Rusyns | 0.7 /100 | #269 | Tragic 5.5% |
| Okinawans | 0.6 /100 | #270 | Tragic 5.5% |
| Immigrants | Sudan | 0.6 /100 | #271 | Tragic 5.5% |
| Immigrants | Kazakhstan | 0.6 /100 | #272 | Tragic 5.5% |
| Macedonians | 0.6 /100 | #273 | Tragic 5.5% |
| Blacks/African Americans | 0.6 /100 | #274 | Tragic 5.5% |
| Cambodians | 0.5 /100 | #275 | Tragic 5.5% |
| Immigrants | Latvia | 0.5 /100 | #276 | Tragic 5.5% |
| Immigrants | Bulgaria | 0.5 /100 | #277 | Tragic 5.5% |
| Immigrants | Eastern Europe | 0.4 /100 | #278 | Tragic 5.4% |
| Immigrants | Uruguay | 0.3 /100 | #279 | Tragic 5.4% |
| Alsatians | 0.3 /100 | #280 | Tragic 5.4% |
| Immigrants | Western Africa | 0.3 /100 | #281 | Tragic 5.4% |
| Immigrants | Spain | 0.3 /100 | #282 | Tragic 5.4% |
| Immigrants | Ireland | 0.3 /100 | #283 | Tragic 5.4% |
Demographics Similar to Vietnamese by 4 or more Vehicles in Household
In terms of 4 or more vehicles in household, the demographic groups most similar to Vietnamese are Immigrants from Bangladesh (3.9%, a difference of 0.51%), Barbadian (3.9%, a difference of 0.69%), Immigrants from Cabo Verde (3.8%, a difference of 1.8%), Immigrants from Trinidad and Tobago (4.1%, a difference of 5.9%), and Immigrants from Albania (4.1%, a difference of 6.1%).
| Demographics | Rating | Rank | 4 or more Vehicles in Household |
| Immigrants | Ecuador | 0.0 /100 | #330 | Tragic 4.2% |
| West Indians | 0.0 /100 | #331 | Tragic 4.2% |
| Immigrants | Dominica | 0.0 /100 | #332 | Tragic 4.2% |
| Immigrants | Albania | 0.0 /100 | #333 | Tragic 4.1% |
| Immigrants | Trinidad and Tobago | 0.0 /100 | #334 | Tragic 4.1% |
| Barbadians | 0.0 /100 | #335 | Tragic 3.9% |
| Immigrants | Bangladesh | 0.0 /100 | #336 | Tragic 3.9% |
| Vietnamese | 0.0 /100 | #337 | Tragic 3.9% |
| Immigrants | Cabo Verde | 0.0 /100 | #338 | Tragic 3.8% |
| Immigrants | Uzbekistan | 0.0 /100 | #339 | Tragic 3.6% |
| Immigrants | Barbados | 0.0 /100 | #340 | Tragic 3.6% |
| Dominicans | 0.0 /100 | #341 | Tragic 3.5% |
| Guyanese | 0.0 /100 | #342 | Tragic 3.5% |
| British West Indians | 0.0 /100 | #343 | Tragic 3.5% |
| Immigrants | Guyana | 0.0 /100 | #344 | Tragic 3.4% |