Polish vs Vietnamese 4 or more Vehicles in Household
COMPARE
Polish
Vietnamese
4 or more Vehicles in Household
4 or more Vehicles in Household Comparison
Poles
Vietnamese
6.4%
4 OR MORE VEHICLES IN HOUSEHOLD
56.9/ 100
METRIC RATING
167th/ 347
METRIC RANK
3.9%
4 OR MORE VEHICLES IN HOUSEHOLD
0.0/ 100
METRIC RATING
337th/ 347
METRIC RANK
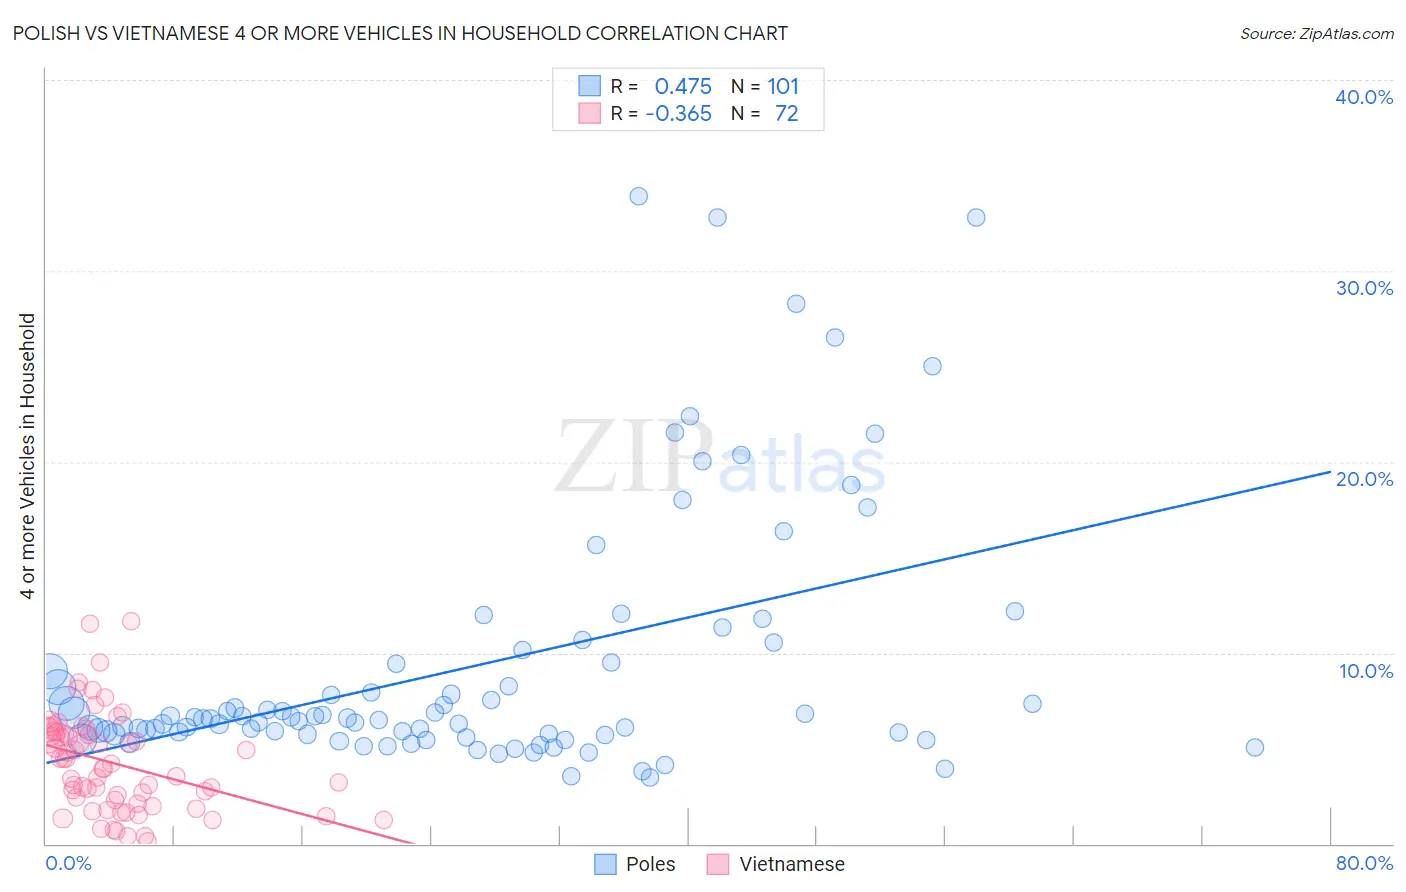
Polish vs Vietnamese 4 or more Vehicles in Household Correlation Chart
The statistical analysis conducted on geographies consisting of 557,050,036 people shows a moderate positive correlation between the proportion of Poles and percentage of households with 4 or more vehicles available in the United States with a correlation coefficient (R) of 0.475 and weighted average of 6.4%. Similarly, the statistical analysis conducted on geographies consisting of 169,814,995 people shows a mild negative correlation between the proportion of Vietnamese and percentage of households with 4 or more vehicles available in the United States with a correlation coefficient (R) of -0.365 and weighted average of 3.9%, a difference of 64.2%.
4 or more Vehicles in Household Correlation Summary
| Measurement | Polish | Vietnamese |
| Minimum | 3.5% | 0.12% |
| Maximum | 33.9% | 11.6% |
| Range | 30.4% | 11.5% |
| Mean | 9.3% | 4.2% |
| Median | 6.6% | 4.1% |
| Interquartile 25% (IQ1) | 5.7% | 2.2% |
| Interquartile 75% (IQ3) | 9.5% | 5.8% |
| Interquartile Range (IQR) | 3.7% | 3.6% |
| Standard Deviation (Sample) | 6.7% | 2.5% |
| Standard Deviation (Population) | 6.7% | 2.5% |
Similar Demographics by 4 or more Vehicles in Household
Demographics Similar to Poles by 4 or more Vehicles in Household
In terms of 4 or more vehicles in household, the demographic groups most similar to Poles are Immigrants from Denmark (6.4%, a difference of 0.10%), Lebanese (6.4%, a difference of 0.11%), Estonian (6.4%, a difference of 0.18%), Immigrants from Peru (6.4%, a difference of 0.31%), and Immigrants from Syria (6.3%, a difference of 0.42%).
| Demographics | Rating | Rank | 4 or more Vehicles in Household |
| Palestinians | 65.8 /100 | #160 | Good 6.4% |
| Immigrants | Cameroon | 64.4 /100 | #161 | Good 6.4% |
| Immigrants | Pakistan | 63.2 /100 | #162 | Good 6.4% |
| Chileans | 61.2 /100 | #163 | Good 6.4% |
| Hungarians | 61.1 /100 | #164 | Good 6.4% |
| Immigrants | Peru | 59.8 /100 | #165 | Average 6.4% |
| Immigrants | Denmark | 57.8 /100 | #166 | Average 6.4% |
| Poles | 56.9 /100 | #167 | Average 6.4% |
| Lebanese | 55.8 /100 | #168 | Average 6.4% |
| Estonians | 55.1 /100 | #169 | Average 6.4% |
| Immigrants | Syria | 52.8 /100 | #170 | Average 6.3% |
| Immigrants | India | 51.9 /100 | #171 | Average 6.3% |
| Immigrants | Lebanon | 51.7 /100 | #172 | Average 6.3% |
| Slovenes | 51.1 /100 | #173 | Average 6.3% |
| Lithuanians | 50.0 /100 | #174 | Average 6.3% |
Demographics Similar to Vietnamese by 4 or more Vehicles in Household
In terms of 4 or more vehicles in household, the demographic groups most similar to Vietnamese are Immigrants from Bangladesh (3.9%, a difference of 0.51%), Barbadian (3.9%, a difference of 0.69%), Immigrants from Cabo Verde (3.8%, a difference of 1.8%), Immigrants from Trinidad and Tobago (4.1%, a difference of 5.9%), and Immigrants from Albania (4.1%, a difference of 6.1%).
| Demographics | Rating | Rank | 4 or more Vehicles in Household |
| Immigrants | Ecuador | 0.0 /100 | #330 | Tragic 4.2% |
| West Indians | 0.0 /100 | #331 | Tragic 4.2% |
| Immigrants | Dominica | 0.0 /100 | #332 | Tragic 4.2% |
| Immigrants | Albania | 0.0 /100 | #333 | Tragic 4.1% |
| Immigrants | Trinidad and Tobago | 0.0 /100 | #334 | Tragic 4.1% |
| Barbadians | 0.0 /100 | #335 | Tragic 3.9% |
| Immigrants | Bangladesh | 0.0 /100 | #336 | Tragic 3.9% |
| Vietnamese | 0.0 /100 | #337 | Tragic 3.9% |
| Immigrants | Cabo Verde | 0.0 /100 | #338 | Tragic 3.8% |
| Immigrants | Uzbekistan | 0.0 /100 | #339 | Tragic 3.6% |
| Immigrants | Barbados | 0.0 /100 | #340 | Tragic 3.6% |
| Dominicans | 0.0 /100 | #341 | Tragic 3.5% |
| Guyanese | 0.0 /100 | #342 | Tragic 3.5% |
| British West Indians | 0.0 /100 | #343 | Tragic 3.5% |
| Immigrants | Guyana | 0.0 /100 | #344 | Tragic 3.4% |