Immigrants from Latin America vs Subsaharan African 4 or more Vehicles in Household
COMPARE
Immigrants from Latin America
Subsaharan African
4 or more Vehicles in Household
4 or more Vehicles in Household Comparison
Immigrants from Latin America
Sub-Saharan Africans
7.1%
4 OR MORE VEHICLES IN HOUSEHOLD
99.4/ 100
METRIC RATING
92nd/ 347
METRIC RANK
5.7%
4 OR MORE VEHICLES IN HOUSEHOLD
2.1/ 100
METRIC RATING
252nd/ 347
METRIC RANK
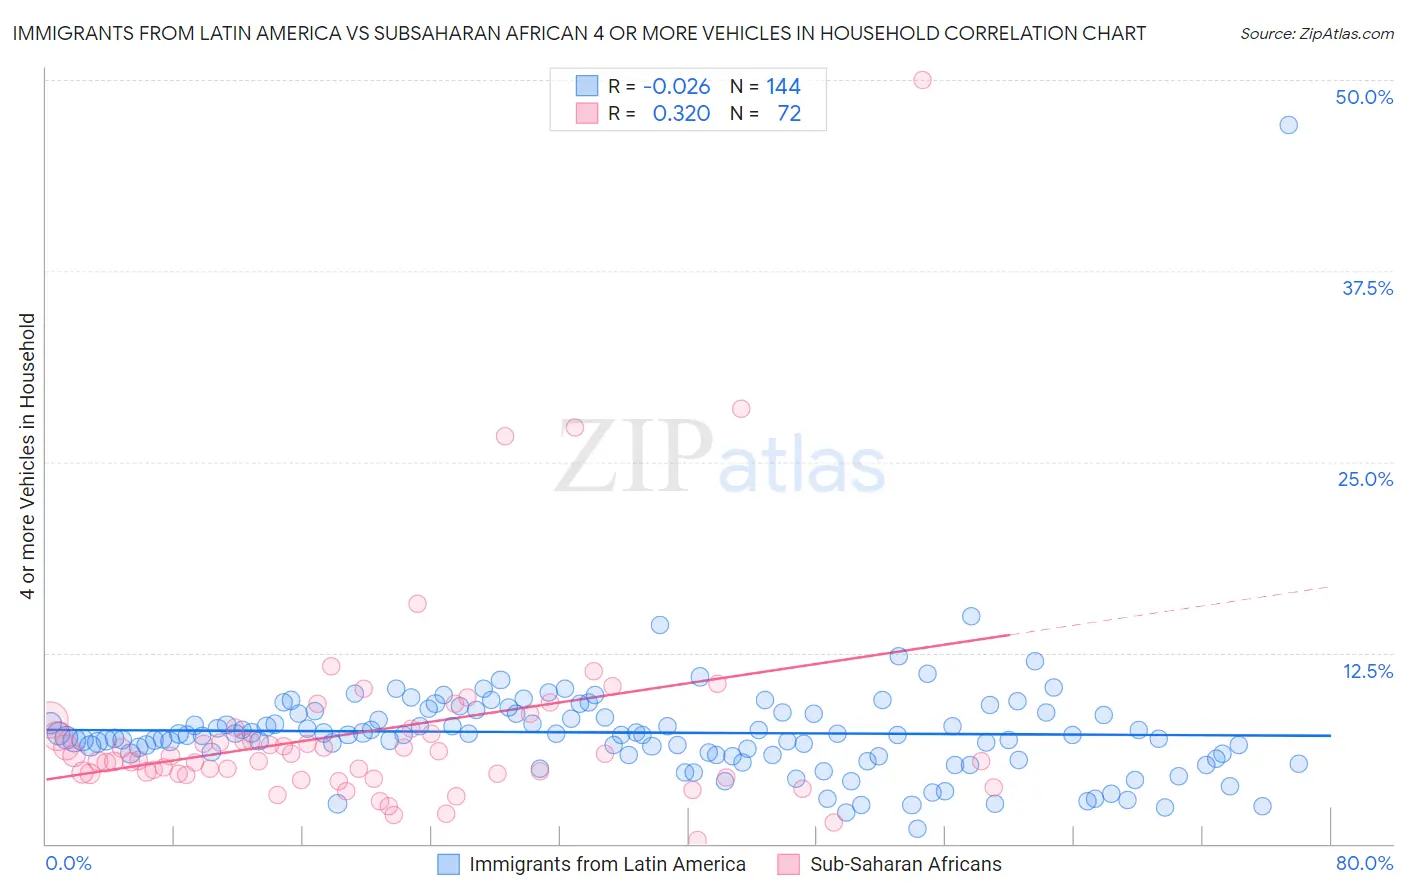
Immigrants from Latin America vs Subsaharan African 4 or more Vehicles in Household Correlation Chart
The statistical analysis conducted on geographies consisting of 555,198,992 people shows no correlation between the proportion of Immigrants from Latin America and percentage of households with 4 or more vehicles available in the United States with a correlation coefficient (R) of -0.026 and weighted average of 7.1%. Similarly, the statistical analysis conducted on geographies consisting of 505,333,507 people shows a mild positive correlation between the proportion of Sub-Saharan Africans and percentage of households with 4 or more vehicles available in the United States with a correlation coefficient (R) of 0.320 and weighted average of 5.7%, a difference of 25.1%.
4 or more Vehicles in Household Correlation Summary
| Measurement | Immigrants from Latin America | Subsaharan African |
| Minimum | 1.0% | 0.25% |
| Maximum | 47.1% | 50.0% |
| Range | 46.0% | 49.8% |
| Mean | 7.3% | 7.4% |
| Median | 7.1% | 5.6% |
| Interquartile 25% (IQ1) | 5.8% | 4.6% |
| Interquartile 75% (IQ3) | 8.5% | 7.4% |
| Interquartile Range (IQR) | 2.8% | 2.8% |
| Standard Deviation (Sample) | 4.1% | 7.2% |
| Standard Deviation (Population) | 4.1% | 7.1% |
Similar Demographics by 4 or more Vehicles in Household
Demographics Similar to Immigrants from Latin America by 4 or more Vehicles in Household
In terms of 4 or more vehicles in household, the demographic groups most similar to Immigrants from Latin America are Assyrian/Chaldean/Syriac (7.2%, a difference of 0.16%), Immigrants from Afghanistan (7.1%, a difference of 0.17%), Dutch West Indian (7.1%, a difference of 0.18%), Czechoslovakian (7.1%, a difference of 0.39%), and Central American (7.1%, a difference of 0.41%).
| Demographics | Rating | Rank | 4 or more Vehicles in Household |
| Cree | 99.7 /100 | #85 | Exceptional 7.2% |
| Immigrants | Indonesia | 99.6 /100 | #86 | Exceptional 7.2% |
| Delaware | 99.6 /100 | #87 | Exceptional 7.2% |
| Immigrants | Nonimmigrants | 99.6 /100 | #88 | Exceptional 7.2% |
| British | 99.6 /100 | #89 | Exceptional 7.2% |
| Creek | 99.6 /100 | #90 | Exceptional 7.2% |
| Assyrians/Chaldeans/Syriacs | 99.4 /100 | #91 | Exceptional 7.2% |
| Immigrants | Latin America | 99.4 /100 | #92 | Exceptional 7.1% |
| Immigrants | Afghanistan | 99.3 /100 | #93 | Exceptional 7.1% |
| Dutch West Indians | 99.3 /100 | #94 | Exceptional 7.1% |
| Czechoslovakians | 99.3 /100 | #95 | Exceptional 7.1% |
| Central Americans | 99.3 /100 | #96 | Exceptional 7.1% |
| Celtics | 99.1 /100 | #97 | Exceptional 7.1% |
| Irish | 99.0 /100 | #98 | Exceptional 7.1% |
| Seminole | 98.8 /100 | #99 | Exceptional 7.0% |
Demographics Similar to Sub-Saharan Africans by 4 or more Vehicles in Household
In terms of 4 or more vehicles in household, the demographic groups most similar to Sub-Saharan Africans are Ugandan (5.7%, a difference of 0.23%), Immigrants from Europe (5.7%, a difference of 0.25%), Immigrants from Southern Europe (5.7%, a difference of 0.35%), Immigrants from Eastern Africa (5.7%, a difference of 0.37%), and Immigrants from Ethiopia (5.7%, a difference of 0.48%).
| Demographics | Rating | Rank | 4 or more Vehicles in Household |
| Bulgarians | 3.1 /100 | #245 | Tragic 5.8% |
| Immigrants | North Macedonia | 2.5 /100 | #246 | Tragic 5.7% |
| Immigrants | Ethiopia | 2.4 /100 | #247 | Tragic 5.7% |
| Immigrants | Eastern Africa | 2.4 /100 | #248 | Tragic 5.7% |
| Immigrants | Southern Europe | 2.3 /100 | #249 | Tragic 5.7% |
| Immigrants | Europe | 2.3 /100 | #250 | Tragic 5.7% |
| Ugandans | 2.2 /100 | #251 | Tragic 5.7% |
| Sub-Saharan Africans | 2.1 /100 | #252 | Tragic 5.7% |
| Immigrants | Cuba | 1.6 /100 | #253 | Tragic 5.7% |
| Immigrants | Panama | 1.5 /100 | #254 | Tragic 5.7% |
| Yup'ik | 1.5 /100 | #255 | Tragic 5.7% |
| Immigrants | Turkey | 1.5 /100 | #256 | Tragic 5.7% |
| Immigrants | Northern Africa | 1.4 /100 | #257 | Tragic 5.6% |
| Immigrants | Lithuania | 1.4 /100 | #258 | Tragic 5.6% |
| Immigrants | France | 1.3 /100 | #259 | Tragic 5.6% |