Immigrants from Western Europe vs Subsaharan African 4 or more Vehicles in Household
COMPARE
Immigrants from Western Europe
Subsaharan African
4 or more Vehicles in Household
4 or more Vehicles in Household Comparison
Immigrants from Western Europe
Sub-Saharan Africans
6.3%
4 OR MORE VEHICLES IN HOUSEHOLD
48.8/ 100
METRIC RATING
175th/ 347
METRIC RANK
5.7%
4 OR MORE VEHICLES IN HOUSEHOLD
2.1/ 100
METRIC RATING
252nd/ 347
METRIC RANK
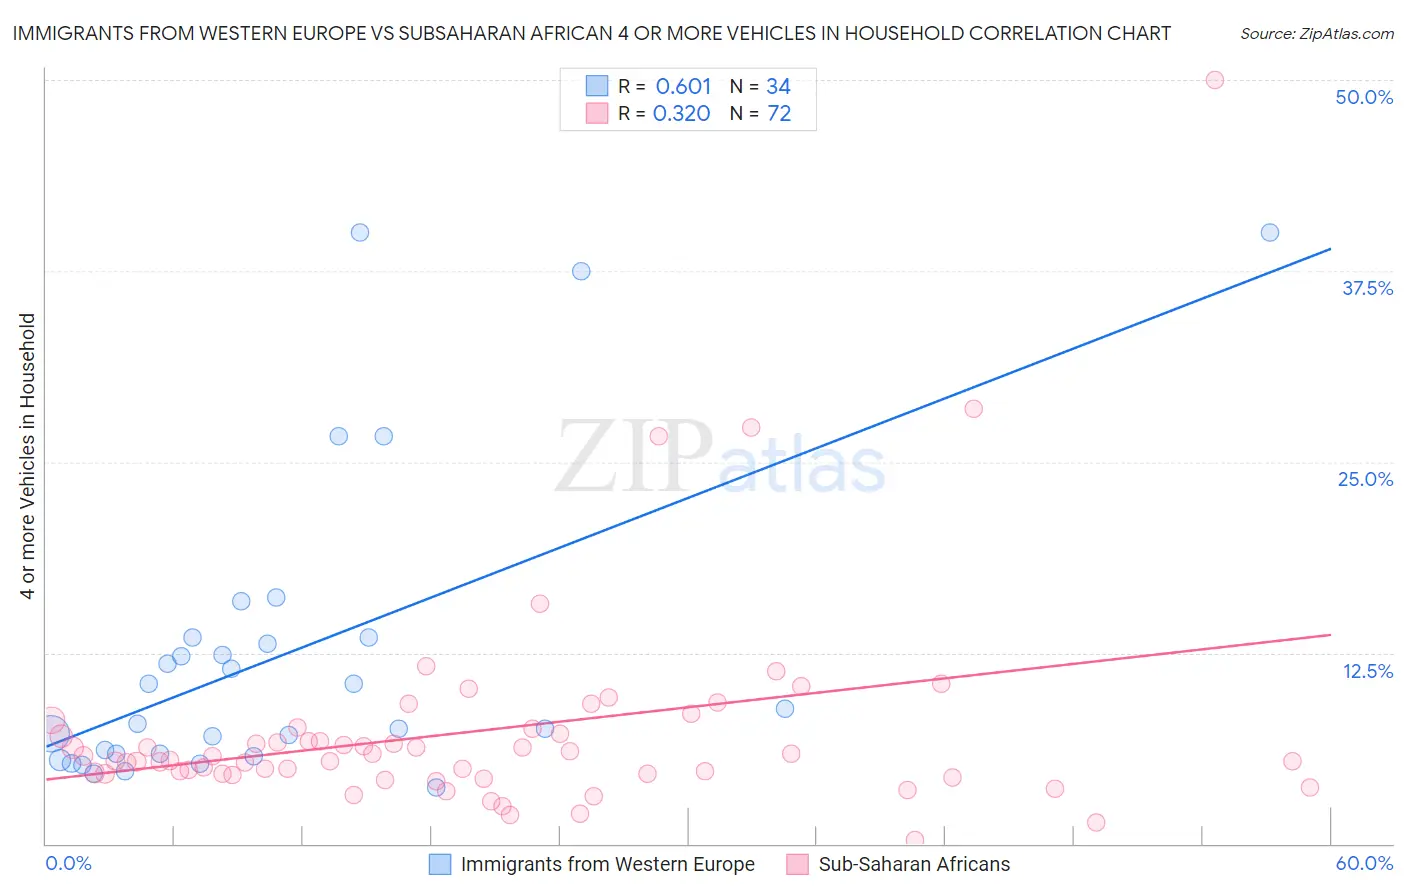
Immigrants from Western Europe vs Subsaharan African 4 or more Vehicles in Household Correlation Chart
The statistical analysis conducted on geographies consisting of 491,787,926 people shows a significant positive correlation between the proportion of Immigrants from Western Europe and percentage of households with 4 or more vehicles available in the United States with a correlation coefficient (R) of 0.601 and weighted average of 6.3%. Similarly, the statistical analysis conducted on geographies consisting of 505,333,507 people shows a mild positive correlation between the proportion of Sub-Saharan Africans and percentage of households with 4 or more vehicles available in the United States with a correlation coefficient (R) of 0.320 and weighted average of 5.7%, a difference of 10.7%.
4 or more Vehicles in Household Correlation Summary
| Measurement | Immigrants from Western Europe | Subsaharan African |
| Minimum | 3.7% | 0.25% |
| Maximum | 40.0% | 50.0% |
| Range | 36.3% | 49.8% |
| Mean | 12.4% | 7.4% |
| Median | 8.3% | 5.6% |
| Interquartile 25% (IQ1) | 5.9% | 4.6% |
| Interquartile 75% (IQ3) | 13.5% | 7.4% |
| Interquartile Range (IQR) | 7.6% | 2.8% |
| Standard Deviation (Sample) | 10.0% | 7.2% |
| Standard Deviation (Population) | 9.9% | 7.1% |
Similar Demographics by 4 or more Vehicles in Household
Demographics Similar to Immigrants from Western Europe by 4 or more Vehicles in Household
In terms of 4 or more vehicles in household, the demographic groups most similar to Immigrants from Western Europe are Lithuanian (6.3%, a difference of 0.12%), Ukrainian (6.3%, a difference of 0.12%), Slovak (6.3%, a difference of 0.20%), Slovene (6.3%, a difference of 0.24%), and Immigrants from Lebanon (6.3%, a difference of 0.29%).
| Demographics | Rating | Rank | 4 or more Vehicles in Household |
| Lebanese | 55.8 /100 | #168 | Average 6.4% |
| Estonians | 55.1 /100 | #169 | Average 6.4% |
| Immigrants | Syria | 52.8 /100 | #170 | Average 6.3% |
| Immigrants | India | 51.9 /100 | #171 | Average 6.3% |
| Immigrants | Lebanon | 51.7 /100 | #172 | Average 6.3% |
| Slovenes | 51.1 /100 | #173 | Average 6.3% |
| Lithuanians | 50.0 /100 | #174 | Average 6.3% |
| Immigrants | Western Europe | 48.8 /100 | #175 | Average 6.3% |
| Ukrainians | 47.6 /100 | #176 | Average 6.3% |
| Slovaks | 46.9 /100 | #177 | Average 6.3% |
| Belizeans | 44.5 /100 | #178 | Average 6.3% |
| Immigrants | Japan | 43.1 /100 | #179 | Average 6.3% |
| Syrians | 42.0 /100 | #180 | Average 6.3% |
| Yugoslavians | 41.1 /100 | #181 | Average 6.3% |
| South American Indians | 40.7 /100 | #182 | Average 6.3% |
Demographics Similar to Sub-Saharan Africans by 4 or more Vehicles in Household
In terms of 4 or more vehicles in household, the demographic groups most similar to Sub-Saharan Africans are Ugandan (5.7%, a difference of 0.23%), Immigrants from Europe (5.7%, a difference of 0.25%), Immigrants from Southern Europe (5.7%, a difference of 0.35%), Immigrants from Eastern Africa (5.7%, a difference of 0.37%), and Immigrants from Ethiopia (5.7%, a difference of 0.48%).
| Demographics | Rating | Rank | 4 or more Vehicles in Household |
| Bulgarians | 3.1 /100 | #245 | Tragic 5.8% |
| Immigrants | North Macedonia | 2.5 /100 | #246 | Tragic 5.7% |
| Immigrants | Ethiopia | 2.4 /100 | #247 | Tragic 5.7% |
| Immigrants | Eastern Africa | 2.4 /100 | #248 | Tragic 5.7% |
| Immigrants | Southern Europe | 2.3 /100 | #249 | Tragic 5.7% |
| Immigrants | Europe | 2.3 /100 | #250 | Tragic 5.7% |
| Ugandans | 2.2 /100 | #251 | Tragic 5.7% |
| Sub-Saharan Africans | 2.1 /100 | #252 | Tragic 5.7% |
| Immigrants | Cuba | 1.6 /100 | #253 | Tragic 5.7% |
| Immigrants | Panama | 1.5 /100 | #254 | Tragic 5.7% |
| Yup'ik | 1.5 /100 | #255 | Tragic 5.7% |
| Immigrants | Turkey | 1.5 /100 | #256 | Tragic 5.7% |
| Immigrants | Northern Africa | 1.4 /100 | #257 | Tragic 5.6% |
| Immigrants | Lithuania | 1.4 /100 | #258 | Tragic 5.6% |
| Immigrants | France | 1.3 /100 | #259 | Tragic 5.6% |