Immigrants from Latin America vs Subsaharan African Median Male Earnings
COMPARE
Immigrants from Latin America
Subsaharan African
Median Male Earnings
Median Male Earnings Comparison
Immigrants from Latin America
Sub-Saharan Africans
$46,941
MEDIAN MALE EARNINGS
0.1/ 100
METRIC RATING
301st/ 347
METRIC RANK
$50,408
MEDIAN MALE EARNINGS
1.8/ 100
METRIC RATING
247th/ 347
METRIC RANK
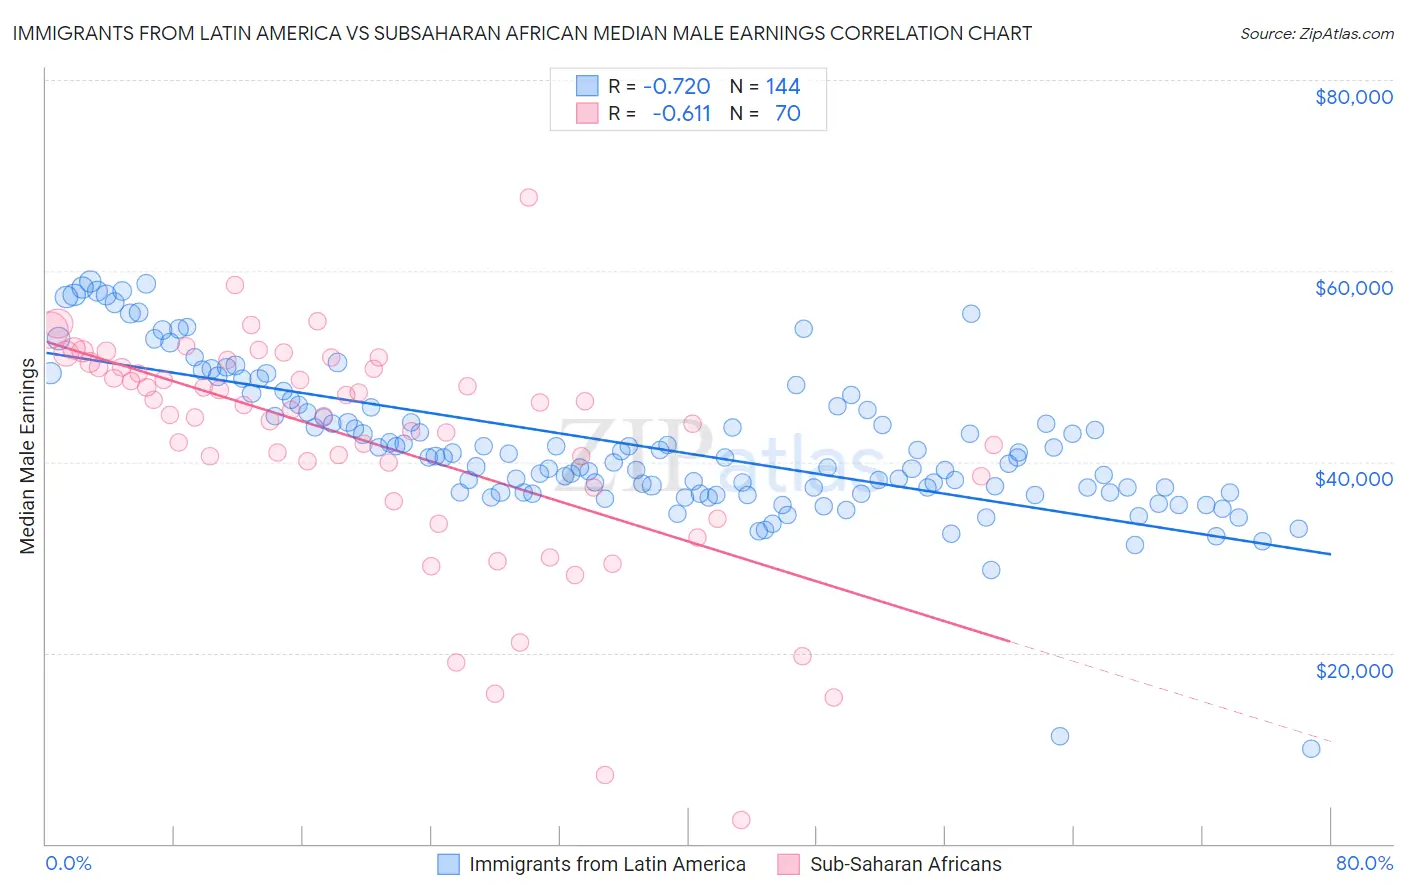
Immigrants from Latin America vs Subsaharan African Median Male Earnings Correlation Chart
The statistical analysis conducted on geographies consisting of 557,625,226 people shows a strong negative correlation between the proportion of Immigrants from Latin America and median male earnings in the United States with a correlation coefficient (R) of -0.720 and weighted average of $46,941. Similarly, the statistical analysis conducted on geographies consisting of 507,818,984 people shows a significant negative correlation between the proportion of Sub-Saharan Africans and median male earnings in the United States with a correlation coefficient (R) of -0.611 and weighted average of $50,408, a difference of 7.4%.
Median Male Earnings Correlation Summary
| Measurement | Immigrants from Latin America | Subsaharan African |
| Minimum | $9,917 | $2,499 |
| Maximum | $58,917 | $67,727 |
| Range | $49,000 | $65,228 |
| Mean | $41,793 | $42,175 |
| Median | $40,483 | $45,761 |
| Interquartile 25% (IQ1) | $36,804 | $38,471 |
| Interquartile 75% (IQ3) | $45,873 | $49,902 |
| Interquartile Range (IQR) | $9,070 | $11,431 |
| Standard Deviation (Sample) | $7,933 | $12,034 |
| Standard Deviation (Population) | $7,905 | $11,948 |
Similar Demographics by Median Male Earnings
Demographics Similar to Immigrants from Latin America by Median Male Earnings
In terms of median male earnings, the demographic groups most similar to Immigrants from Latin America are U.S. Virgin Islander ($47,066, a difference of 0.27%), Immigrants from Zaire ($47,070, a difference of 0.28%), Seminole ($46,783, a difference of 0.34%), Yaqui ($46,777, a difference of 0.35%), and Bangladeshi ($46,744, a difference of 0.42%).
| Demographics | Rating | Rank | Median Male Earnings |
| Immigrants | Nicaragua | 0.1 /100 | #294 | Tragic $47,482 |
| Central American Indians | 0.1 /100 | #295 | Tragic $47,433 |
| Inupiat | 0.1 /100 | #296 | Tragic $47,281 |
| Dominicans | 0.1 /100 | #297 | Tragic $47,204 |
| Immigrants | Micronesia | 0.1 /100 | #298 | Tragic $47,177 |
| Immigrants | Zaire | 0.1 /100 | #299 | Tragic $47,070 |
| U.S. Virgin Islanders | 0.1 /100 | #300 | Tragic $47,066 |
| Immigrants | Latin America | 0.1 /100 | #301 | Tragic $46,941 |
| Seminole | 0.1 /100 | #302 | Tragic $46,783 |
| Yaqui | 0.1 /100 | #303 | Tragic $46,777 |
| Bangladeshis | 0.1 /100 | #304 | Tragic $46,744 |
| Guatemalans | 0.0 /100 | #305 | Tragic $46,736 |
| Dutch West Indians | 0.0 /100 | #306 | Tragic $46,656 |
| Immigrants | Dominican Republic | 0.0 /100 | #307 | Tragic $46,655 |
| Ottawa | 0.0 /100 | #308 | Tragic $46,611 |
Demographics Similar to Sub-Saharan Africans by Median Male Earnings
In terms of median male earnings, the demographic groups most similar to Sub-Saharan Africans are Immigrants from Ecuador ($50,474, a difference of 0.13%), Hawaiian ($50,488, a difference of 0.16%), Immigrants from Guyana ($50,321, a difference of 0.17%), Immigrants from Burma/Myanmar ($50,298, a difference of 0.22%), and Osage ($50,292, a difference of 0.23%).
| Demographics | Rating | Rank | Median Male Earnings |
| West Indians | 2.3 /100 | #240 | Tragic $50,682 |
| Immigrants | St. Vincent and the Grenadines | 2.3 /100 | #241 | Tragic $50,665 |
| Guyanese | 2.2 /100 | #242 | Tragic $50,613 |
| French American Indians | 2.2 /100 | #243 | Tragic $50,611 |
| Houma | 2.0 /100 | #244 | Tragic $50,547 |
| Hawaiians | 1.9 /100 | #245 | Tragic $50,488 |
| Immigrants | Ecuador | 1.9 /100 | #246 | Tragic $50,474 |
| Sub-Saharan Africans | 1.8 /100 | #247 | Tragic $50,408 |
| Immigrants | Guyana | 1.6 /100 | #248 | Tragic $50,321 |
| Immigrants | Burma/Myanmar | 1.6 /100 | #249 | Tragic $50,298 |
| Osage | 1.6 /100 | #250 | Tragic $50,292 |
| Immigrants | Grenada | 1.6 /100 | #251 | Tragic $50,279 |
| Immigrants | Cabo Verde | 1.2 /100 | #252 | Tragic $50,009 |
| German Russians | 1.1 /100 | #253 | Tragic $49,924 |
| Senegalese | 1.0 /100 | #254 | Tragic $49,774 |