British West Indian vs Scotch-Irish 4 or more Vehicles in Household
COMPARE
British West Indian
Scotch-Irish
4 or more Vehicles in Household
4 or more Vehicles in Household Comparison
British West Indians
Scotch-Irish
3.5%
4 OR MORE VEHICLES IN HOUSEHOLD
0.0/ 100
METRIC RATING
343rd/ 347
METRIC RANK
7.4%
4 OR MORE VEHICLES IN HOUSEHOLD
99.9/ 100
METRIC RATING
72nd/ 347
METRIC RANK
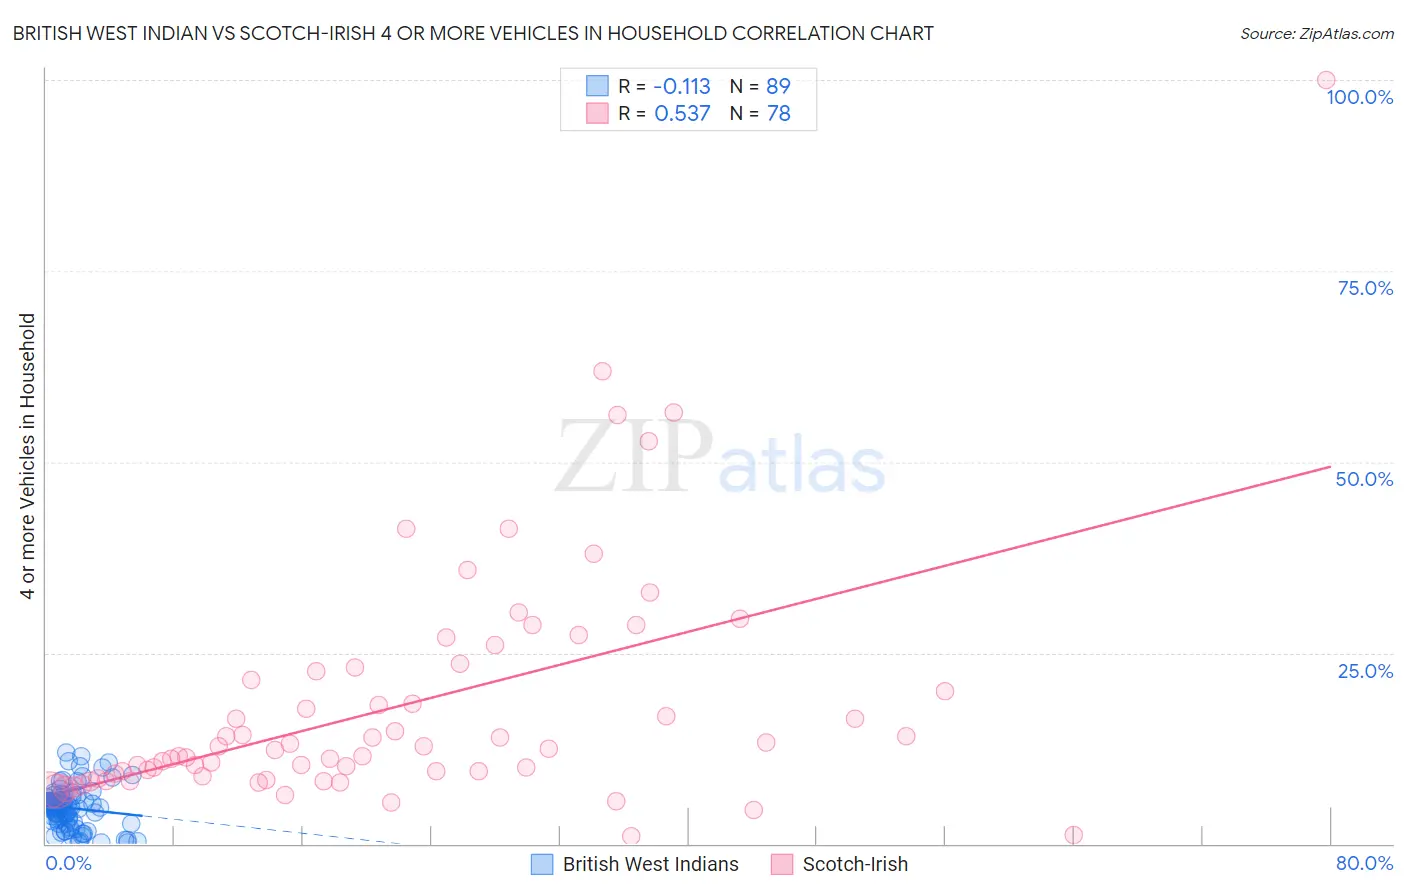
British West Indian vs Scotch-Irish 4 or more Vehicles in Household Correlation Chart
The statistical analysis conducted on geographies consisting of 151,775,264 people shows a poor negative correlation between the proportion of British West Indians and percentage of households with 4 or more vehicles available in the United States with a correlation coefficient (R) of -0.113 and weighted average of 3.5%. Similarly, the statistical analysis conducted on geographies consisting of 546,031,323 people shows a substantial positive correlation between the proportion of Scotch-Irish and percentage of households with 4 or more vehicles available in the United States with a correlation coefficient (R) of 0.537 and weighted average of 7.4%, a difference of 114.7%.
4 or more Vehicles in Household Correlation Summary
| Measurement | British West Indian | Scotch-Irish |
| Minimum | 0.11% | 0.97% |
| Maximum | 11.9% | 100.0% |
| Range | 11.8% | 99.0% |
| Mean | 4.7% | 18.1% |
| Median | 4.8% | 12.4% |
| Interquartile 25% (IQ1) | 2.7% | 8.8% |
| Interquartile 75% (IQ3) | 5.7% | 22.6% |
| Interquartile Range (IQR) | 3.0% | 13.8% |
| Standard Deviation (Sample) | 2.7% | 16.0% |
| Standard Deviation (Population) | 2.7% | 15.8% |
Similar Demographics by 4 or more Vehicles in Household
Demographics Similar to British West Indians by 4 or more Vehicles in Household
In terms of 4 or more vehicles in household, the demographic groups most similar to British West Indians are Guyanese (3.5%, a difference of 0.94%), Immigrants from Guyana (3.4%, a difference of 1.6%), Dominican (3.5%, a difference of 1.6%), Immigrants from Barbados (3.6%, a difference of 4.5%), and Immigrants from Uzbekistan (3.6%, a difference of 5.0%).
| Demographics | Rating | Rank | 4 or more Vehicles in Household |
| Immigrants | Albania | 0.0 /100 | #333 | Tragic 4.1% |
| Immigrants | Trinidad and Tobago | 0.0 /100 | #334 | Tragic 4.1% |
| Barbadians | 0.0 /100 | #335 | Tragic 3.9% |
| Immigrants | Bangladesh | 0.0 /100 | #336 | Tragic 3.9% |
| Vietnamese | 0.0 /100 | #337 | Tragic 3.9% |
| Immigrants | Cabo Verde | 0.0 /100 | #338 | Tragic 3.8% |
| Immigrants | Uzbekistan | 0.0 /100 | #339 | Tragic 3.6% |
| Immigrants | Barbados | 0.0 /100 | #340 | Tragic 3.6% |
| Dominicans | 0.0 /100 | #341 | Tragic 3.5% |
| Guyanese | 0.0 /100 | #342 | Tragic 3.5% |
| British West Indians | 0.0 /100 | #343 | Tragic 3.5% |
| Immigrants | Guyana | 0.0 /100 | #344 | Tragic 3.4% |
| Immigrants | Dominican Republic | 0.0 /100 | #345 | Tragic 3.3% |
| Immigrants | St. Vincent and the Grenadines | 0.0 /100 | #346 | Tragic 3.0% |
| Immigrants | Grenada | 0.0 /100 | #347 | Tragic 2.7% |
Demographics Similar to Scotch-Irish by 4 or more Vehicles in Household
In terms of 4 or more vehicles in household, the demographic groups most similar to Scotch-Irish are Portuguese (7.4%, a difference of 0.090%), Chickasaw (7.4%, a difference of 0.30%), Icelander (7.4%, a difference of 0.39%), Immigrants from Cambodia (7.4%, a difference of 0.40%), and Scottish (7.4%, a difference of 0.43%).
| Demographics | Rating | Rank | 4 or more Vehicles in Household |
| Immigrants | Azores | 100.0 /100 | #65 | Exceptional 7.5% |
| Immigrants | Taiwan | 99.9 /100 | #66 | Exceptional 7.5% |
| Americans | 99.9 /100 | #67 | Exceptional 7.5% |
| Welsh | 99.9 /100 | #68 | Exceptional 7.5% |
| Germans | 99.9 /100 | #69 | Exceptional 7.5% |
| Scottish | 99.9 /100 | #70 | Exceptional 7.4% |
| Chickasaw | 99.9 /100 | #71 | Exceptional 7.4% |
| Scotch-Irish | 99.9 /100 | #72 | Exceptional 7.4% |
| Portuguese | 99.9 /100 | #73 | Exceptional 7.4% |
| Icelanders | 99.9 /100 | #74 | Exceptional 7.4% |
| Immigrants | Cambodia | 99.9 /100 | #75 | Exceptional 7.4% |
| Laotians | 99.9 /100 | #76 | Exceptional 7.4% |
| Apache | 99.9 /100 | #77 | Exceptional 7.4% |
| Whites/Caucasians | 99.8 /100 | #78 | Exceptional 7.4% |
| Czechs | 99.8 /100 | #79 | Exceptional 7.4% |