Immigrants from Latin America vs Scotch-Irish 10th Grade
COMPARE
Immigrants from Latin America
Scotch-Irish
10th Grade
10th Grade Comparison
Immigrants from Latin America
Scotch-Irish
88.3%
10TH GRADE
0.0/ 100
METRIC RATING
338th/ 347
METRIC RANK
95.2%
10TH GRADE
99.9/ 100
METRIC RATING
40th/ 347
METRIC RANK
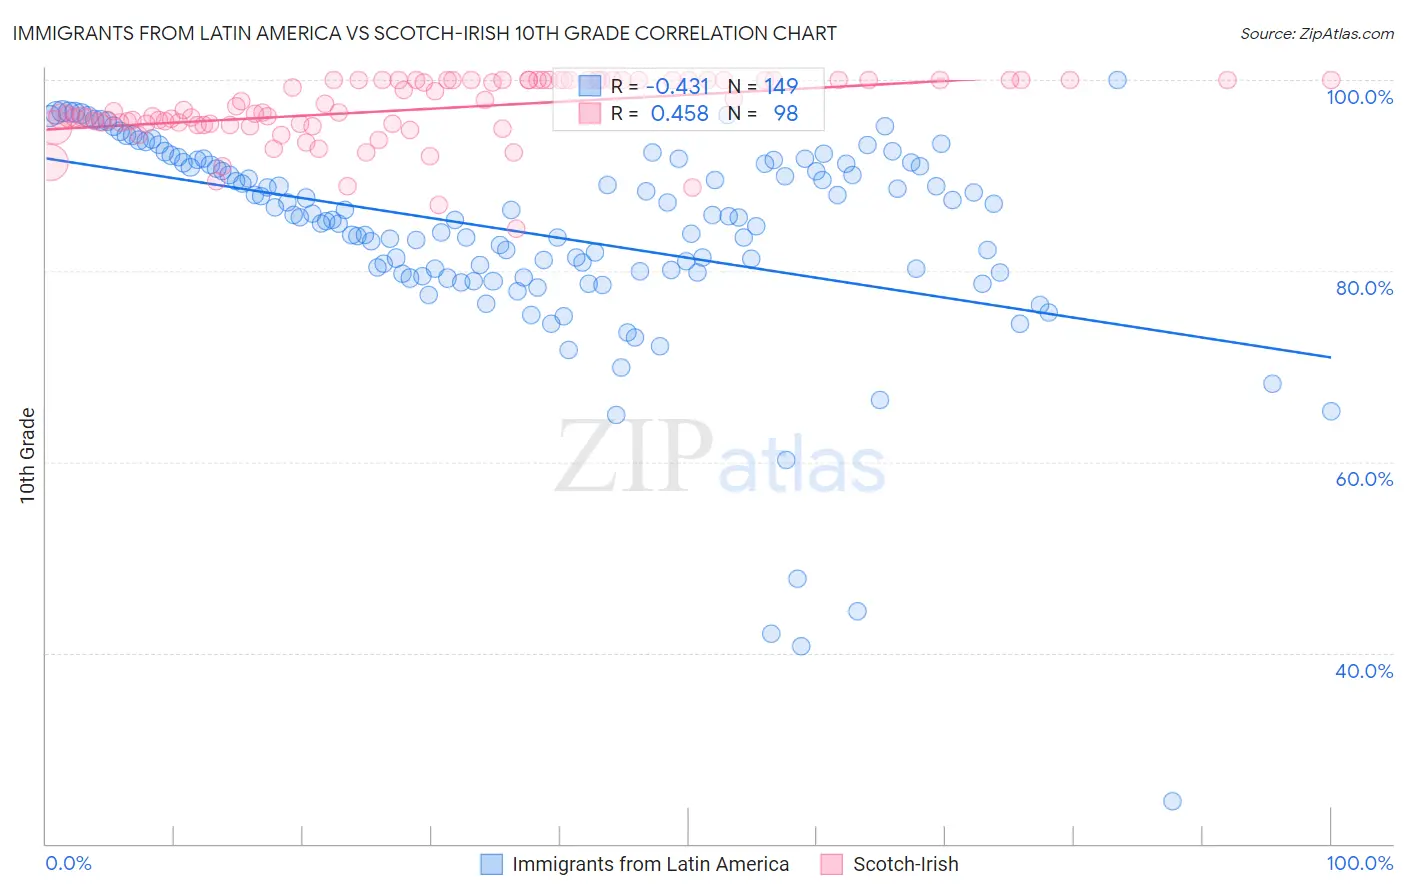
Immigrants from Latin America vs Scotch-Irish 10th Grade Correlation Chart
The statistical analysis conducted on geographies consisting of 558,651,423 people shows a moderate negative correlation between the proportion of Immigrants from Latin America and percentage of population with at least 10th grade education in the United States with a correlation coefficient (R) of -0.431 and weighted average of 88.3%. Similarly, the statistical analysis conducted on geographies consisting of 548,777,546 people shows a moderate positive correlation between the proportion of Scotch-Irish and percentage of population with at least 10th grade education in the United States with a correlation coefficient (R) of 0.458 and weighted average of 95.2%, a difference of 7.8%.
10th Grade Correlation Summary
| Measurement | Immigrants from Latin America | Scotch-Irish |
| Minimum | 24.5% | 84.4% |
| Maximum | 100.0% | 100.0% |
| Range | 75.5% | 15.6% |
| Mean | 83.8% | 96.9% |
| Median | 85.6% | 96.7% |
| Interquartile 25% (IQ1) | 79.8% | 95.4% |
| Interquartile 75% (IQ3) | 91.2% | 100.0% |
| Interquartile Range (IQR) | 11.4% | 4.6% |
| Standard Deviation (Sample) | 11.2% | 3.3% |
| Standard Deviation (Population) | 11.1% | 3.3% |
Similar Demographics by 10th Grade
Demographics Similar to Immigrants from Latin America by 10th Grade
In terms of 10th grade, the demographic groups most similar to Immigrants from Latin America are Central American (88.4%, a difference of 0.060%), Immigrants from Honduras (88.5%, a difference of 0.21%), Immigrants from Dominican Republic (88.7%, a difference of 0.41%), Guatemalan (87.9%, a difference of 0.49%), and Hispanic or Latino (88.9%, a difference of 0.59%).
| Demographics | Rating | Rank | 10th Grade |
| Mexican American Indians | 0.0 /100 | #331 | Tragic 89.0% |
| Immigrants | Azores | 0.0 /100 | #332 | Tragic 89.0% |
| Hondurans | 0.0 /100 | #333 | Tragic 89.0% |
| Hispanics or Latinos | 0.0 /100 | #334 | Tragic 88.9% |
| Immigrants | Dominican Republic | 0.0 /100 | #335 | Tragic 88.7% |
| Immigrants | Honduras | 0.0 /100 | #336 | Tragic 88.5% |
| Central Americans | 0.0 /100 | #337 | Tragic 88.4% |
| Immigrants | Latin America | 0.0 /100 | #338 | Tragic 88.3% |
| Guatemalans | 0.0 /100 | #339 | Tragic 87.9% |
| Mexicans | 0.0 /100 | #340 | Tragic 87.8% |
| Salvadorans | 0.0 /100 | #341 | Tragic 87.5% |
| Immigrants | Guatemala | 0.0 /100 | #342 | Tragic 87.4% |
| Yakama | 0.0 /100 | #343 | Tragic 86.9% |
| Immigrants | El Salvador | 0.0 /100 | #344 | Tragic 86.8% |
| Immigrants | Central America | 0.0 /100 | #345 | Tragic 86.6% |
Demographics Similar to Scotch-Irish by 10th Grade
In terms of 10th grade, the demographic groups most similar to Scotch-Irish are Immigrants from Scotland (95.2%, a difference of 0.0%), Russian (95.2%, a difference of 0.020%), Northern European (95.3%, a difference of 0.030%), French Canadian (95.3%, a difference of 0.060%), and Slavic (95.2%, a difference of 0.060%).
| Demographics | Rating | Rank | 10th Grade |
| French | 100.0 /100 | #33 | Exceptional 95.3% |
| British | 99.9 /100 | #34 | Exceptional 95.3% |
| Estonians | 99.9 /100 | #35 | Exceptional 95.3% |
| Immigrants | India | 99.9 /100 | #36 | Exceptional 95.3% |
| French Canadians | 99.9 /100 | #37 | Exceptional 95.3% |
| Northern Europeans | 99.9 /100 | #38 | Exceptional 95.3% |
| Immigrants | Scotland | 99.9 /100 | #39 | Exceptional 95.2% |
| Scotch-Irish | 99.9 /100 | #40 | Exceptional 95.2% |
| Russians | 99.9 /100 | #41 | Exceptional 95.2% |
| Slavs | 99.9 /100 | #42 | Exceptional 95.2% |
| Macedonians | 99.9 /100 | #43 | Exceptional 95.2% |
| Immigrants | Northern Europe | 99.9 /100 | #44 | Exceptional 95.2% |
| Greeks | 99.9 /100 | #45 | Exceptional 95.2% |
| Czechoslovakians | 99.9 /100 | #46 | Exceptional 95.1% |
| Serbians | 99.9 /100 | #47 | Exceptional 95.1% |