Native/Alaskan vs Scotch-Irish 4 or more Vehicles in Household
COMPARE
Native/Alaskan
Scotch-Irish
4 or more Vehicles in Household
4 or more Vehicles in Household Comparison
Natives/Alaskans
Scotch-Irish
8.2%
4 OR MORE VEHICLES IN HOUSEHOLD
100.0/ 100
METRIC RATING
31st/ 347
METRIC RANK
7.4%
4 OR MORE VEHICLES IN HOUSEHOLD
99.9/ 100
METRIC RATING
72nd/ 347
METRIC RANK
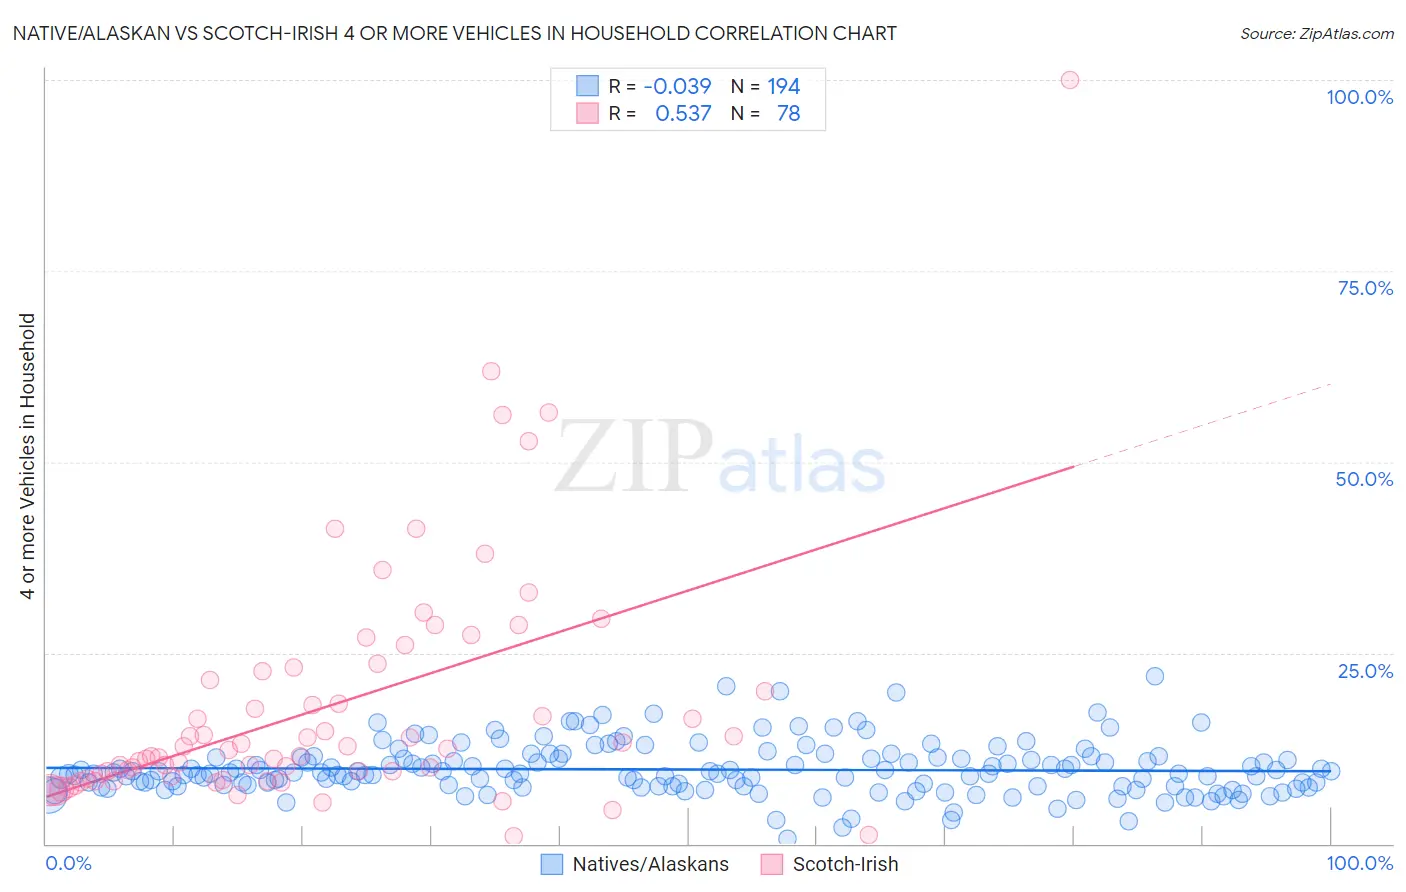
Native/Alaskan vs Scotch-Irish 4 or more Vehicles in Household Correlation Chart
The statistical analysis conducted on geographies consisting of 510,504,827 people shows no correlation between the proportion of Natives/Alaskans and percentage of households with 4 or more vehicles available in the United States with a correlation coefficient (R) of -0.039 and weighted average of 8.2%. Similarly, the statistical analysis conducted on geographies consisting of 546,031,323 people shows a substantial positive correlation between the proportion of Scotch-Irish and percentage of households with 4 or more vehicles available in the United States with a correlation coefficient (R) of 0.537 and weighted average of 7.4%, a difference of 10.5%.
4 or more Vehicles in Household Correlation Summary
| Measurement | Native/Alaskan | Scotch-Irish |
| Minimum | 0.68% | 0.97% |
| Maximum | 21.9% | 100.0% |
| Range | 21.2% | 99.0% |
| Mean | 9.7% | 18.1% |
| Median | 9.2% | 12.4% |
| Interquartile 25% (IQ1) | 7.5% | 8.8% |
| Interquartile 75% (IQ3) | 11.3% | 22.6% |
| Interquartile Range (IQR) | 3.7% | 13.8% |
| Standard Deviation (Sample) | 3.4% | 16.0% |
| Standard Deviation (Population) | 3.4% | 15.8% |
Similar Demographics by 4 or more Vehicles in Household
Demographics Similar to Natives/Alaskans by 4 or more Vehicles in Household
In terms of 4 or more vehicles in household, the demographic groups most similar to Natives/Alaskans are Navajo (8.2%, a difference of 0.40%), Immigrants from South Eastern Asia (8.2%, a difference of 0.43%), Marshallese (8.1%, a difference of 0.53%), Yaqui (8.1%, a difference of 0.82%), and Cheyenne (8.3%, a difference of 1.1%).
| Demographics | Rating | Rank | 4 or more Vehicles in Household |
| Immigrants | Central America | 100.0 /100 | #24 | Exceptional 8.5% |
| Basques | 100.0 /100 | #25 | Exceptional 8.4% |
| Mexican American Indians | 100.0 /100 | #26 | Exceptional 8.4% |
| Sri Lankans | 100.0 /100 | #27 | Exceptional 8.4% |
| Cheyenne | 100.0 /100 | #28 | Exceptional 8.3% |
| Immigrants | South Eastern Asia | 100.0 /100 | #29 | Exceptional 8.2% |
| Navajo | 100.0 /100 | #30 | Exceptional 8.2% |
| Natives/Alaskans | 100.0 /100 | #31 | Exceptional 8.2% |
| Marshallese | 100.0 /100 | #32 | Exceptional 8.1% |
| Yaqui | 100.0 /100 | #33 | Exceptional 8.1% |
| Alaskan Athabascans | 100.0 /100 | #34 | Exceptional 8.1% |
| Guamanians/Chamorros | 100.0 /100 | #35 | Exceptional 8.1% |
| Norwegians | 100.0 /100 | #36 | Exceptional 8.0% |
| Scandinavians | 100.0 /100 | #37 | Exceptional 8.0% |
| Sioux | 100.0 /100 | #38 | Exceptional 8.0% |
Demographics Similar to Scotch-Irish by 4 or more Vehicles in Household
In terms of 4 or more vehicles in household, the demographic groups most similar to Scotch-Irish are Portuguese (7.4%, a difference of 0.090%), Chickasaw (7.4%, a difference of 0.30%), Icelander (7.4%, a difference of 0.39%), Immigrants from Cambodia (7.4%, a difference of 0.40%), and Scottish (7.4%, a difference of 0.43%).
| Demographics | Rating | Rank | 4 or more Vehicles in Household |
| Immigrants | Azores | 100.0 /100 | #65 | Exceptional 7.5% |
| Immigrants | Taiwan | 99.9 /100 | #66 | Exceptional 7.5% |
| Americans | 99.9 /100 | #67 | Exceptional 7.5% |
| Welsh | 99.9 /100 | #68 | Exceptional 7.5% |
| Germans | 99.9 /100 | #69 | Exceptional 7.5% |
| Scottish | 99.9 /100 | #70 | Exceptional 7.4% |
| Chickasaw | 99.9 /100 | #71 | Exceptional 7.4% |
| Scotch-Irish | 99.9 /100 | #72 | Exceptional 7.4% |
| Portuguese | 99.9 /100 | #73 | Exceptional 7.4% |
| Icelanders | 99.9 /100 | #74 | Exceptional 7.4% |
| Immigrants | Cambodia | 99.9 /100 | #75 | Exceptional 7.4% |
| Laotians | 99.9 /100 | #76 | Exceptional 7.4% |
| Apache | 99.9 /100 | #77 | Exceptional 7.4% |
| Whites/Caucasians | 99.8 /100 | #78 | Exceptional 7.4% |
| Czechs | 99.8 /100 | #79 | Exceptional 7.4% |