African vs Scotch-Irish 4 or more Vehicles in Household
COMPARE
African
Scotch-Irish
4 or more Vehicles in Household
4 or more Vehicles in Household Comparison
Africans
Scotch-Irish
5.8%
4 OR MORE VEHICLES IN HOUSEHOLD
4.6/ 100
METRIC RATING
234th/ 347
METRIC RANK
7.4%
4 OR MORE VEHICLES IN HOUSEHOLD
99.9/ 100
METRIC RATING
72nd/ 347
METRIC RANK
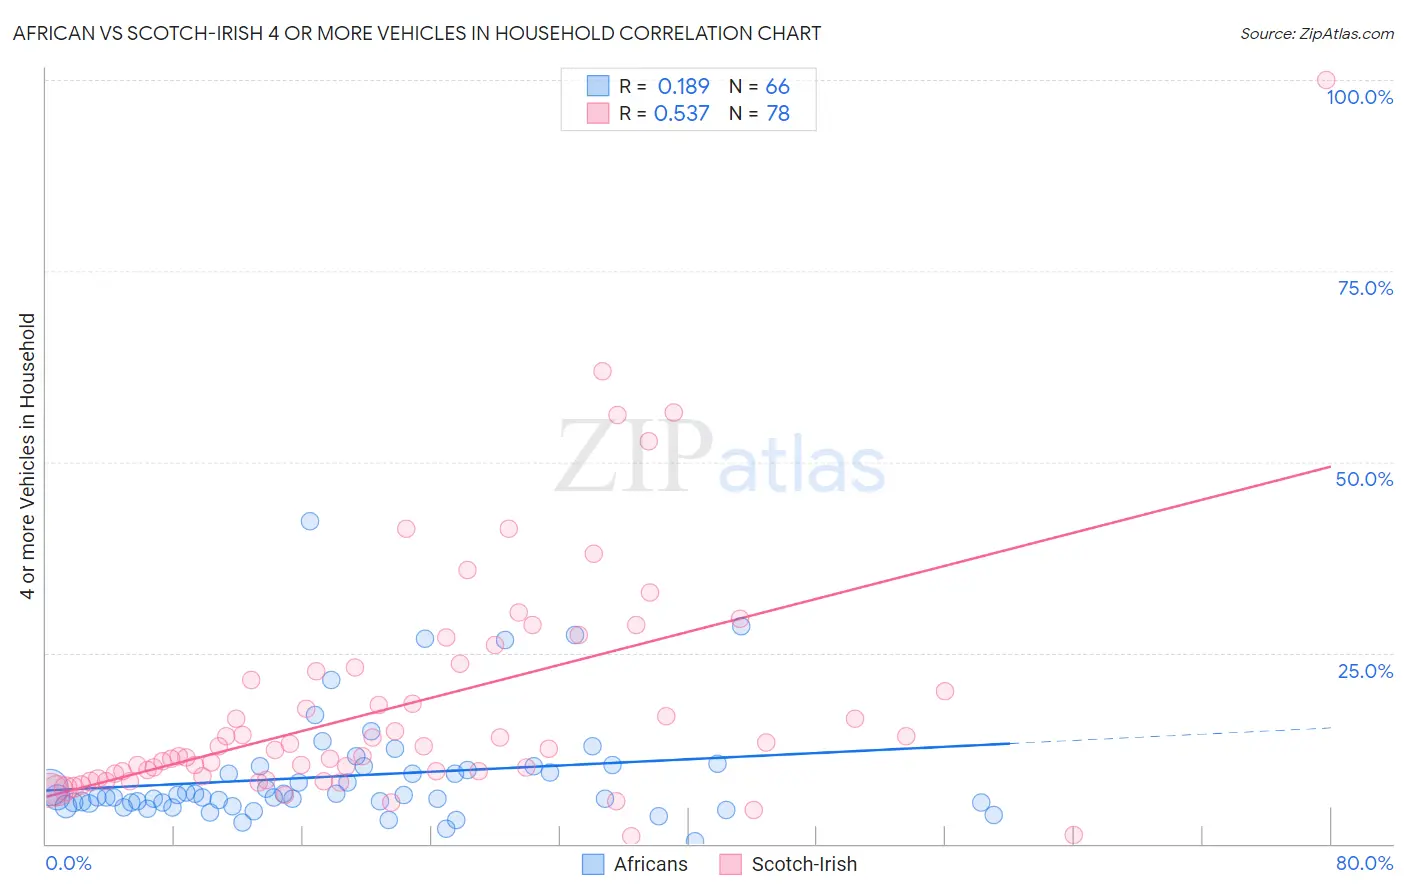
African vs Scotch-Irish 4 or more Vehicles in Household Correlation Chart
The statistical analysis conducted on geographies consisting of 467,634,971 people shows a poor positive correlation between the proportion of Africans and percentage of households with 4 or more vehicles available in the United States with a correlation coefficient (R) of 0.189 and weighted average of 5.8%. Similarly, the statistical analysis conducted on geographies consisting of 546,031,323 people shows a substantial positive correlation between the proportion of Scotch-Irish and percentage of households with 4 or more vehicles available in the United States with a correlation coefficient (R) of 0.537 and weighted average of 7.4%, a difference of 26.9%.
4 or more Vehicles in Household Correlation Summary
| Measurement | African | Scotch-Irish |
| Minimum | 0.25% | 0.97% |
| Maximum | 42.3% | 100.0% |
| Range | 42.1% | 99.0% |
| Mean | 8.9% | 18.1% |
| Median | 6.1% | 12.4% |
| Interquartile 25% (IQ1) | 5.4% | 8.8% |
| Interquartile 75% (IQ3) | 10.2% | 22.6% |
| Interquartile Range (IQR) | 4.8% | 13.8% |
| Standard Deviation (Sample) | 7.3% | 16.0% |
| Standard Deviation (Population) | 7.2% | 15.8% |
Similar Demographics by 4 or more Vehicles in Household
Demographics Similar to Africans by 4 or more Vehicles in Household
In terms of 4 or more vehicles in household, the demographic groups most similar to Africans are Immigrants from Hungary (5.8%, a difference of 0.020%), Immigrants from Eritrea (5.8%, a difference of 0.030%), Turkish (5.8%, a difference of 0.31%), Immigrants from Belgium (5.8%, a difference of 0.44%), and Immigrants from Australia (5.8%, a difference of 0.53%).
| Demographics | Rating | Rank | 4 or more Vehicles in Household |
| Immigrants | Western Asia | 7.8 /100 | #227 | Tragic 5.9% |
| Immigrants | Uganda | 7.5 /100 | #228 | Tragic 5.9% |
| Eastern Europeans | 6.8 /100 | #229 | Tragic 5.9% |
| Immigrants | Malaysia | 6.7 /100 | #230 | Tragic 5.9% |
| Immigrants | Switzerland | 6.4 /100 | #231 | Tragic 5.9% |
| Immigrants | Argentina | 6.0 /100 | #232 | Tragic 5.9% |
| Sierra Leoneans | 6.0 /100 | #233 | Tragic 5.9% |
| Africans | 4.6 /100 | #234 | Tragic 5.8% |
| Immigrants | Hungary | 4.6 /100 | #235 | Tragic 5.8% |
| Immigrants | Eritrea | 4.5 /100 | #236 | Tragic 5.8% |
| Turks | 4.1 /100 | #237 | Tragic 5.8% |
| Immigrants | Belgium | 4.0 /100 | #238 | Tragic 5.8% |
| Immigrants | Australia | 3.8 /100 | #239 | Tragic 5.8% |
| Immigrants | Poland | 3.8 /100 | #240 | Tragic 5.8% |
| Mongolians | 3.7 /100 | #241 | Tragic 5.8% |
Demographics Similar to Scotch-Irish by 4 or more Vehicles in Household
In terms of 4 or more vehicles in household, the demographic groups most similar to Scotch-Irish are Portuguese (7.4%, a difference of 0.090%), Chickasaw (7.4%, a difference of 0.30%), Icelander (7.4%, a difference of 0.39%), Immigrants from Cambodia (7.4%, a difference of 0.40%), and Scottish (7.4%, a difference of 0.43%).
| Demographics | Rating | Rank | 4 or more Vehicles in Household |
| Immigrants | Azores | 100.0 /100 | #65 | Exceptional 7.5% |
| Immigrants | Taiwan | 99.9 /100 | #66 | Exceptional 7.5% |
| Americans | 99.9 /100 | #67 | Exceptional 7.5% |
| Welsh | 99.9 /100 | #68 | Exceptional 7.5% |
| Germans | 99.9 /100 | #69 | Exceptional 7.5% |
| Scottish | 99.9 /100 | #70 | Exceptional 7.4% |
| Chickasaw | 99.9 /100 | #71 | Exceptional 7.4% |
| Scotch-Irish | 99.9 /100 | #72 | Exceptional 7.4% |
| Portuguese | 99.9 /100 | #73 | Exceptional 7.4% |
| Icelanders | 99.9 /100 | #74 | Exceptional 7.4% |
| Immigrants | Cambodia | 99.9 /100 | #75 | Exceptional 7.4% |
| Laotians | 99.9 /100 | #76 | Exceptional 7.4% |
| Apache | 99.9 /100 | #77 | Exceptional 7.4% |
| Whites/Caucasians | 99.8 /100 | #78 | Exceptional 7.4% |
| Czechs | 99.8 /100 | #79 | Exceptional 7.4% |