Immigrants from Sierra Leone vs Scotch-Irish 4 or more Vehicles in Household
COMPARE
Immigrants from Sierra Leone
Scotch-Irish
4 or more Vehicles in Household
4 or more Vehicles in Household Comparison
Immigrants from Sierra Leone
Scotch-Irish
6.1%
4 OR MORE VEHICLES IN HOUSEHOLD
20.5/ 100
METRIC RATING
203rd/ 347
METRIC RANK
7.4%
4 OR MORE VEHICLES IN HOUSEHOLD
99.9/ 100
METRIC RATING
72nd/ 347
METRIC RANK
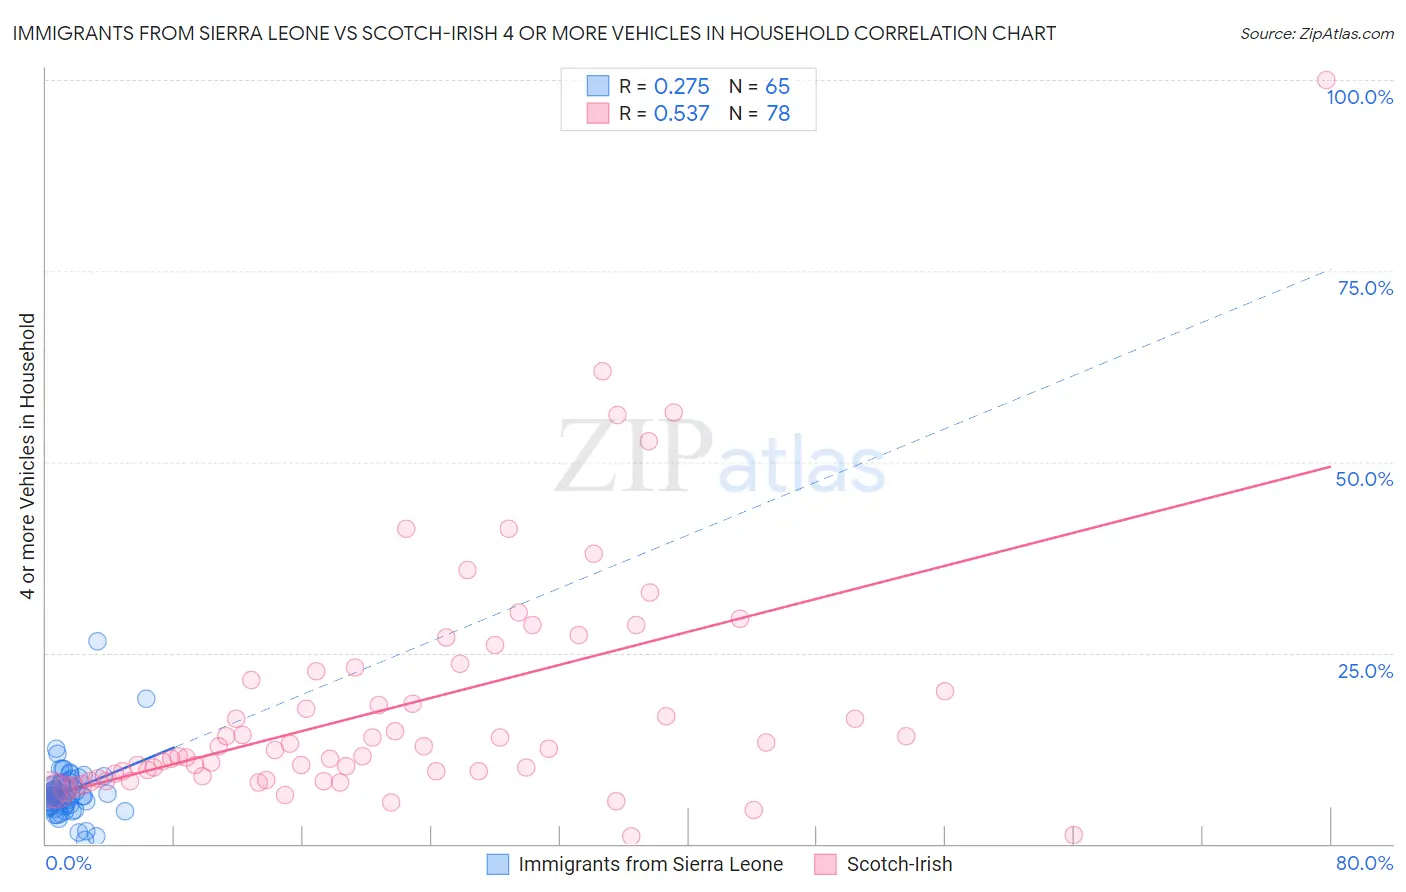
Immigrants from Sierra Leone vs Scotch-Irish 4 or more Vehicles in Household Correlation Chart
The statistical analysis conducted on geographies consisting of 101,342,659 people shows a weak positive correlation between the proportion of Immigrants from Sierra Leone and percentage of households with 4 or more vehicles available in the United States with a correlation coefficient (R) of 0.275 and weighted average of 6.1%. Similarly, the statistical analysis conducted on geographies consisting of 546,031,323 people shows a substantial positive correlation between the proportion of Scotch-Irish and percentage of households with 4 or more vehicles available in the United States with a correlation coefficient (R) of 0.537 and weighted average of 7.4%, a difference of 21.4%.
4 or more Vehicles in Household Correlation Summary
| Measurement | Immigrants from Sierra Leone | Scotch-Irish |
| Minimum | 0.48% | 0.97% |
| Maximum | 26.5% | 100.0% |
| Range | 26.0% | 99.0% |
| Mean | 6.8% | 18.1% |
| Median | 6.3% | 12.4% |
| Interquartile 25% (IQ1) | 5.0% | 8.8% |
| Interquartile 75% (IQ3) | 7.8% | 22.6% |
| Interquartile Range (IQR) | 2.7% | 13.8% |
| Standard Deviation (Sample) | 3.7% | 16.0% |
| Standard Deviation (Population) | 3.7% | 15.8% |
Similar Demographics by 4 or more Vehicles in Household
Demographics Similar to Immigrants from Sierra Leone by 4 or more Vehicles in Household
In terms of 4 or more vehicles in household, the demographic groups most similar to Immigrants from Sierra Leone are Immigrants from Belize (6.1%, a difference of 0.10%), Immigrants from South Central Asia (6.1%, a difference of 0.14%), Egyptian (6.1%, a difference of 0.15%), Honduran (6.1%, a difference of 0.19%), and Immigrants from Norway (6.1%, a difference of 0.20%).
| Demographics | Rating | Rank | 4 or more Vehicles in Household |
| Tsimshian | 26.4 /100 | #196 | Fair 6.2% |
| Immigrants | Sri Lanka | 23.7 /100 | #197 | Fair 6.1% |
| Immigrants | Portugal | 22.3 /100 | #198 | Fair 6.1% |
| Immigrants | Norway | 21.8 /100 | #199 | Fair 6.1% |
| Latvians | 21.7 /100 | #200 | Fair 6.1% |
| Egyptians | 21.4 /100 | #201 | Fair 6.1% |
| Immigrants | South Central Asia | 21.3 /100 | #202 | Fair 6.1% |
| Immigrants | Sierra Leone | 20.5 /100 | #203 | Fair 6.1% |
| Immigrants | Belize | 19.8 /100 | #204 | Poor 6.1% |
| Hondurans | 19.3 /100 | #205 | Poor 6.1% |
| Kenyans | 18.5 /100 | #206 | Poor 6.1% |
| Immigrants | Chile | 16.9 /100 | #207 | Poor 6.1% |
| Immigrants | Nigeria | 15.6 /100 | #208 | Poor 6.1% |
| Immigrants | Honduras | 15.4 /100 | #209 | Poor 6.1% |
| Immigrants | Zimbabwe | 15.1 /100 | #210 | Poor 6.0% |
Demographics Similar to Scotch-Irish by 4 or more Vehicles in Household
In terms of 4 or more vehicles in household, the demographic groups most similar to Scotch-Irish are Portuguese (7.4%, a difference of 0.090%), Chickasaw (7.4%, a difference of 0.30%), Icelander (7.4%, a difference of 0.39%), Immigrants from Cambodia (7.4%, a difference of 0.40%), and Scottish (7.4%, a difference of 0.43%).
| Demographics | Rating | Rank | 4 or more Vehicles in Household |
| Immigrants | Azores | 100.0 /100 | #65 | Exceptional 7.5% |
| Immigrants | Taiwan | 99.9 /100 | #66 | Exceptional 7.5% |
| Americans | 99.9 /100 | #67 | Exceptional 7.5% |
| Welsh | 99.9 /100 | #68 | Exceptional 7.5% |
| Germans | 99.9 /100 | #69 | Exceptional 7.5% |
| Scottish | 99.9 /100 | #70 | Exceptional 7.4% |
| Chickasaw | 99.9 /100 | #71 | Exceptional 7.4% |
| Scotch-Irish | 99.9 /100 | #72 | Exceptional 7.4% |
| Portuguese | 99.9 /100 | #73 | Exceptional 7.4% |
| Icelanders | 99.9 /100 | #74 | Exceptional 7.4% |
| Immigrants | Cambodia | 99.9 /100 | #75 | Exceptional 7.4% |
| Laotians | 99.9 /100 | #76 | Exceptional 7.4% |
| Apache | 99.9 /100 | #77 | Exceptional 7.4% |
| Whites/Caucasians | 99.8 /100 | #78 | Exceptional 7.4% |
| Czechs | 99.8 /100 | #79 | Exceptional 7.4% |