Immigrants from Latin America vs Scotch-Irish Median Male Earnings
COMPARE
Immigrants from Latin America
Scotch-Irish
Median Male Earnings
Median Male Earnings Comparison
Immigrants from Latin America
Scotch-Irish
$46,941
MEDIAN MALE EARNINGS
0.1/ 100
METRIC RATING
301st/ 347
METRIC RANK
$53,658
MEDIAN MALE EARNINGS
30.6/ 100
METRIC RATING
192nd/ 347
METRIC RANK
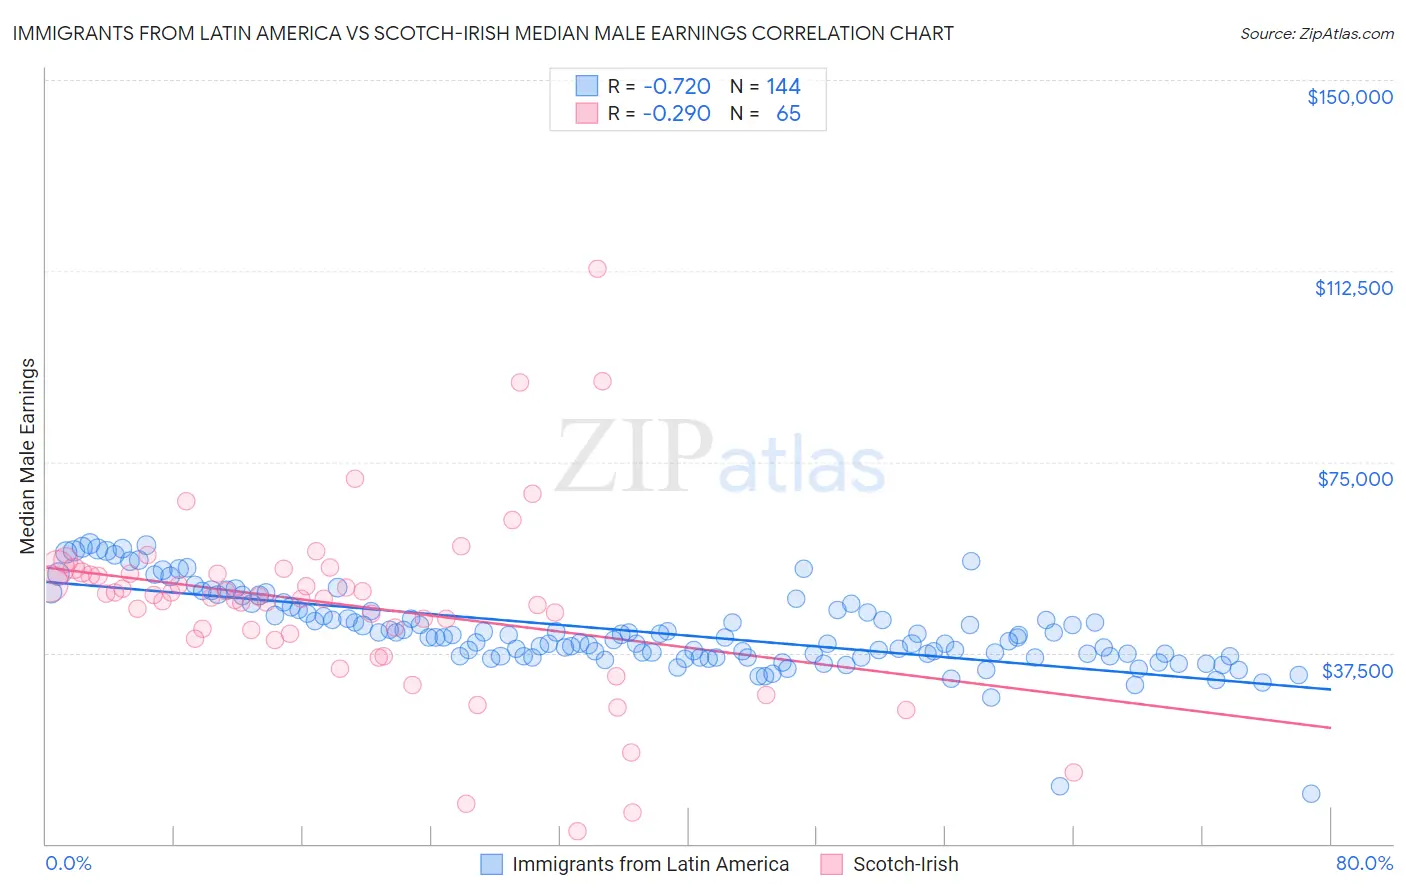
Immigrants from Latin America vs Scotch-Irish Median Male Earnings Correlation Chart
The statistical analysis conducted on geographies consisting of 557,625,226 people shows a strong negative correlation between the proportion of Immigrants from Latin America and median male earnings in the United States with a correlation coefficient (R) of -0.720 and weighted average of $46,941. Similarly, the statistical analysis conducted on geographies consisting of 547,724,250 people shows a weak negative correlation between the proportion of Scotch-Irish and median male earnings in the United States with a correlation coefficient (R) of -0.290 and weighted average of $53,658, a difference of 14.3%.
Median Male Earnings Correlation Summary
| Measurement | Immigrants from Latin America | Scotch-Irish |
| Minimum | $9,917 | $2,499 |
| Maximum | $58,917 | $113,000 |
| Range | $49,000 | $110,501 |
| Mean | $41,793 | $47,040 |
| Median | $40,483 | $48,432 |
| Interquartile 25% (IQ1) | $36,804 | $40,813 |
| Interquartile 75% (IQ3) | $45,873 | $53,223 |
| Interquartile Range (IQR) | $9,070 | $12,411 |
| Standard Deviation (Sample) | $7,933 | $17,914 |
| Standard Deviation (Population) | $7,905 | $17,776 |
Similar Demographics by Median Male Earnings
Demographics Similar to Immigrants from Latin America by Median Male Earnings
In terms of median male earnings, the demographic groups most similar to Immigrants from Latin America are U.S. Virgin Islander ($47,066, a difference of 0.27%), Immigrants from Zaire ($47,070, a difference of 0.28%), Seminole ($46,783, a difference of 0.34%), Yaqui ($46,777, a difference of 0.35%), and Bangladeshi ($46,744, a difference of 0.42%).
| Demographics | Rating | Rank | Median Male Earnings |
| Immigrants | Nicaragua | 0.1 /100 | #294 | Tragic $47,482 |
| Central American Indians | 0.1 /100 | #295 | Tragic $47,433 |
| Inupiat | 0.1 /100 | #296 | Tragic $47,281 |
| Dominicans | 0.1 /100 | #297 | Tragic $47,204 |
| Immigrants | Micronesia | 0.1 /100 | #298 | Tragic $47,177 |
| Immigrants | Zaire | 0.1 /100 | #299 | Tragic $47,070 |
| U.S. Virgin Islanders | 0.1 /100 | #300 | Tragic $47,066 |
| Immigrants | Latin America | 0.1 /100 | #301 | Tragic $46,941 |
| Seminole | 0.1 /100 | #302 | Tragic $46,783 |
| Yaqui | 0.1 /100 | #303 | Tragic $46,777 |
| Bangladeshis | 0.1 /100 | #304 | Tragic $46,744 |
| Guatemalans | 0.0 /100 | #305 | Tragic $46,736 |
| Dutch West Indians | 0.0 /100 | #306 | Tragic $46,656 |
| Immigrants | Dominican Republic | 0.0 /100 | #307 | Tragic $46,655 |
| Ottawa | 0.0 /100 | #308 | Tragic $46,611 |
Demographics Similar to Scotch-Irish by Median Male Earnings
In terms of median male earnings, the demographic groups most similar to Scotch-Irish are Guamanian/Chamorro ($53,661, a difference of 0.010%), Kenyan ($53,647, a difference of 0.020%), Uruguayan ($53,680, a difference of 0.040%), Puget Sound Salish ($53,704, a difference of 0.090%), and Immigrants from Eastern Africa ($53,713, a difference of 0.10%).
| Demographics | Rating | Rank | Median Male Earnings |
| Immigrants | Sierra Leone | 36.0 /100 | #185 | Fair $53,905 |
| Colombians | 34.4 /100 | #186 | Fair $53,832 |
| Immigrants | Eritrea | 31.8 /100 | #187 | Fair $53,715 |
| Immigrants | Eastern Africa | 31.8 /100 | #188 | Fair $53,713 |
| Puget Sound Salish | 31.6 /100 | #189 | Fair $53,704 |
| Uruguayans | 31.1 /100 | #190 | Fair $53,680 |
| Guamanians/Chamorros | 30.7 /100 | #191 | Fair $53,661 |
| Scotch-Irish | 30.6 /100 | #192 | Fair $53,658 |
| Kenyans | 30.4 /100 | #193 | Fair $53,647 |
| Spanish | 29.0 /100 | #194 | Fair $53,576 |
| Immigrants | Azores | 27.5 /100 | #195 | Fair $53,503 |
| Immigrants | Africa | 26.6 /100 | #196 | Fair $53,457 |
| Immigrants | Kenya | 26.0 /100 | #197 | Fair $53,427 |
| Immigrants | Costa Rica | 22.6 /100 | #198 | Fair $53,237 |
| Tongans | 22.3 /100 | #199 | Fair $53,218 |