Immigrants from Israel vs Scotch-Irish 4 or more Vehicles in Household
COMPARE
Immigrants from Israel
Scotch-Irish
4 or more Vehicles in Household
4 or more Vehicles in Household Comparison
Immigrants from Israel
Scotch-Irish
4.8%
4 OR MORE VEHICLES IN HOUSEHOLD
0.0/ 100
METRIC RATING
313th/ 347
METRIC RANK
7.4%
4 OR MORE VEHICLES IN HOUSEHOLD
99.9/ 100
METRIC RATING
72nd/ 347
METRIC RANK
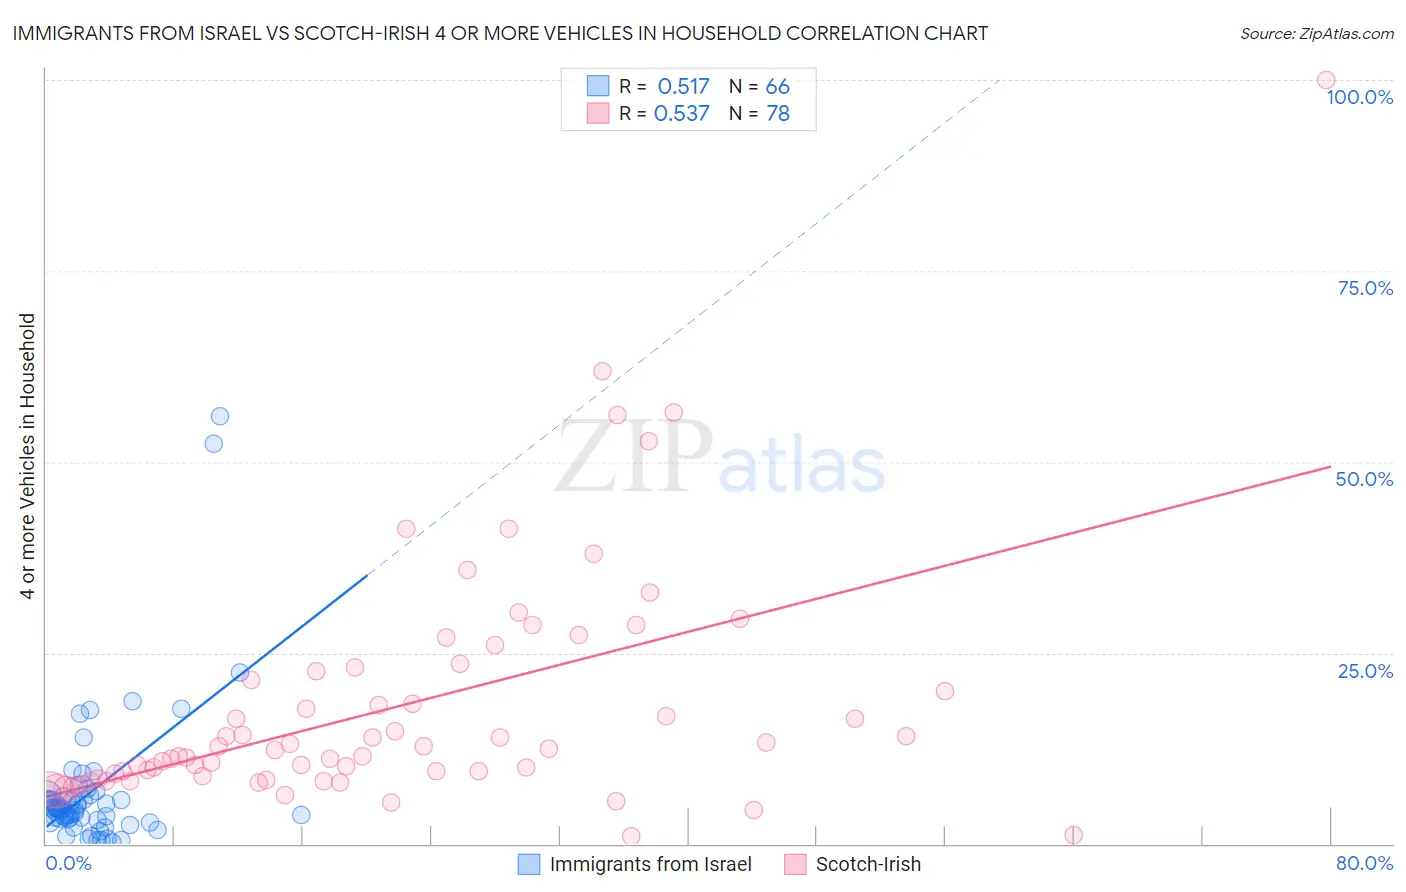
Immigrants from Israel vs Scotch-Irish 4 or more Vehicles in Household Correlation Chart
The statistical analysis conducted on geographies consisting of 208,870,296 people shows a substantial positive correlation between the proportion of Immigrants from Israel and percentage of households with 4 or more vehicles available in the United States with a correlation coefficient (R) of 0.517 and weighted average of 4.8%. Similarly, the statistical analysis conducted on geographies consisting of 546,031,323 people shows a substantial positive correlation between the proportion of Scotch-Irish and percentage of households with 4 or more vehicles available in the United States with a correlation coefficient (R) of 0.537 and weighted average of 7.4%, a difference of 55.0%.
4 or more Vehicles in Household Correlation Summary
| Measurement | Immigrants from Israel | Scotch-Irish |
| Minimum | 0.22% | 0.97% |
| Maximum | 55.9% | 100.0% |
| Range | 55.7% | 99.0% |
| Mean | 6.9% | 18.1% |
| Median | 4.6% | 12.4% |
| Interquartile 25% (IQ1) | 3.3% | 8.8% |
| Interquartile 75% (IQ3) | 6.3% | 22.6% |
| Interquartile Range (IQR) | 3.0% | 13.8% |
| Standard Deviation (Sample) | 9.6% | 16.0% |
| Standard Deviation (Population) | 9.5% | 15.8% |
Similar Demographics by 4 or more Vehicles in Household
Demographics Similar to Immigrants from Israel by 4 or more Vehicles in Household
In terms of 4 or more vehicles in household, the demographic groups most similar to Immigrants from Israel are Albanian (4.8%, a difference of 0.010%), Immigrants from West Indies (4.7%, a difference of 0.79%), Immigrants from Belarus (4.7%, a difference of 0.88%), Puerto Rican (4.7%, a difference of 1.3%), and Houma (4.9%, a difference of 2.7%).
| Demographics | Rating | Rank | 4 or more Vehicles in Household |
| Immigrants | Serbia | 0.0 /100 | #306 | Tragic 5.0% |
| Menominee | 0.0 /100 | #307 | Tragic 5.0% |
| Paraguayans | 0.0 /100 | #308 | Tragic 4.9% |
| Immigrants | Somalia | 0.0 /100 | #309 | Tragic 4.9% |
| Moroccans | 0.0 /100 | #310 | Tragic 4.9% |
| Houma | 0.0 /100 | #311 | Tragic 4.9% |
| Albanians | 0.0 /100 | #312 | Tragic 4.8% |
| Immigrants | Israel | 0.0 /100 | #313 | Tragic 4.8% |
| Immigrants | West Indies | 0.0 /100 | #314 | Tragic 4.7% |
| Immigrants | Belarus | 0.0 /100 | #315 | Tragic 4.7% |
| Puerto Ricans | 0.0 /100 | #316 | Tragic 4.7% |
| U.S. Virgin Islanders | 0.0 /100 | #317 | Tragic 4.6% |
| Jamaicans | 0.0 /100 | #318 | Tragic 4.6% |
| Haitians | 0.0 /100 | #319 | Tragic 4.6% |
| Immigrants | Haiti | 0.0 /100 | #320 | Tragic 4.5% |
Demographics Similar to Scotch-Irish by 4 or more Vehicles in Household
In terms of 4 or more vehicles in household, the demographic groups most similar to Scotch-Irish are Portuguese (7.4%, a difference of 0.090%), Chickasaw (7.4%, a difference of 0.30%), Icelander (7.4%, a difference of 0.39%), Immigrants from Cambodia (7.4%, a difference of 0.40%), and Scottish (7.4%, a difference of 0.43%).
| Demographics | Rating | Rank | 4 or more Vehicles in Household |
| Immigrants | Azores | 100.0 /100 | #65 | Exceptional 7.5% |
| Immigrants | Taiwan | 99.9 /100 | #66 | Exceptional 7.5% |
| Americans | 99.9 /100 | #67 | Exceptional 7.5% |
| Welsh | 99.9 /100 | #68 | Exceptional 7.5% |
| Germans | 99.9 /100 | #69 | Exceptional 7.5% |
| Scottish | 99.9 /100 | #70 | Exceptional 7.4% |
| Chickasaw | 99.9 /100 | #71 | Exceptional 7.4% |
| Scotch-Irish | 99.9 /100 | #72 | Exceptional 7.4% |
| Portuguese | 99.9 /100 | #73 | Exceptional 7.4% |
| Icelanders | 99.9 /100 | #74 | Exceptional 7.4% |
| Immigrants | Cambodia | 99.9 /100 | #75 | Exceptional 7.4% |
| Laotians | 99.9 /100 | #76 | Exceptional 7.4% |
| Apache | 99.9 /100 | #77 | Exceptional 7.4% |
| Whites/Caucasians | 99.8 /100 | #78 | Exceptional 7.4% |
| Czechs | 99.8 /100 | #79 | Exceptional 7.4% |