Immigrants from Japan vs Nonimmigrants 3 or more Vehicles in Household
COMPARE
Immigrants from Japan
Nonimmigrants
3 or more Vehicles in Household
3 or more Vehicles in Household Comparison
Immigrants from Japan
Nonimmigrants
19.0%
3 OR MORE VEHICLES IN HOUSEHOLD
22.0/ 100
METRIC RATING
197th/ 347
METRIC RANK
21.8%
3 OR MORE VEHICLES IN HOUSEHOLD
99.8/ 100
METRIC RATING
76th/ 347
METRIC RANK
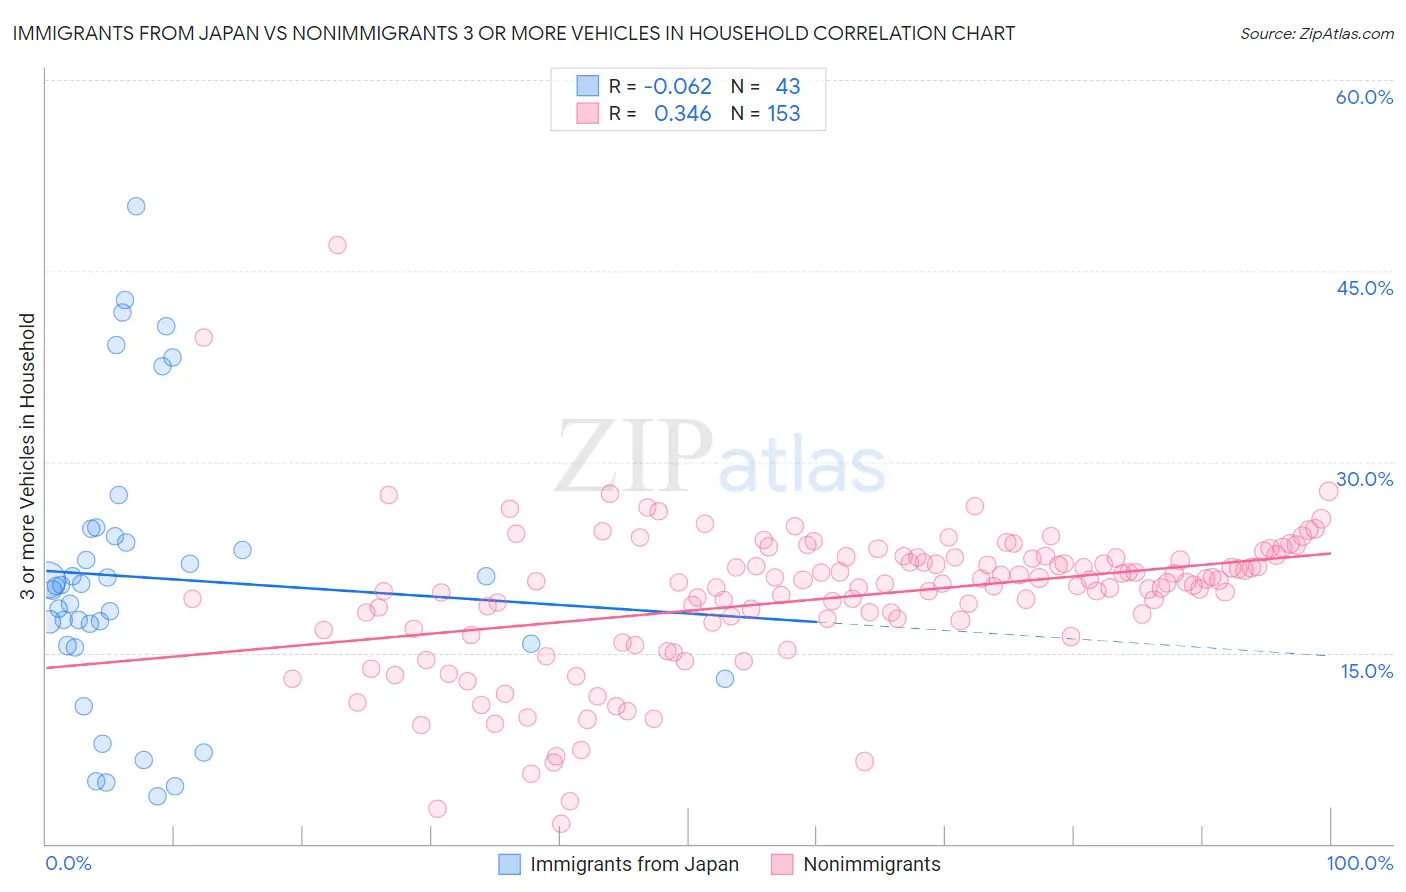
Immigrants from Japan vs Nonimmigrants 3 or more Vehicles in Household Correlation Chart
The statistical analysis conducted on geographies consisting of 339,875,755 people shows a slight negative correlation between the proportion of Immigrants from Japan and percentage of households with 3 or more vehicles available in the United States with a correlation coefficient (R) of -0.062 and weighted average of 19.0%. Similarly, the statistical analysis conducted on geographies consisting of 584,058,560 people shows a mild positive correlation between the proportion of Nonimmigrants and percentage of households with 3 or more vehicles available in the United States with a correlation coefficient (R) of 0.346 and weighted average of 21.8%, a difference of 14.4%.
3 or more Vehicles in Household Correlation Summary
| Measurement | Immigrants from Japan | Nonimmigrants |
| Minimum | 3.8% | 1.6% |
| Maximum | 50.1% | 47.1% |
| Range | 46.3% | 45.5% |
| Mean | 20.9% | 19.3% |
| Median | 20.3% | 20.4% |
| Interquartile 25% (IQ1) | 15.6% | 17.2% |
| Interquartile 75% (IQ3) | 24.2% | 22.5% |
| Interquartile Range (IQR) | 8.6% | 5.3% |
| Standard Deviation (Sample) | 11.0% | 5.9% |
| Standard Deviation (Population) | 10.9% | 5.9% |
Similar Demographics by 3 or more Vehicles in Household
Demographics Similar to Immigrants from Japan by 3 or more Vehicles in Household
In terms of 3 or more vehicles in household, the demographic groups most similar to Immigrants from Japan are Central American Indian (19.0%, a difference of 0.030%), Immigrants from Moldova (19.1%, a difference of 0.18%), Serbian (19.1%, a difference of 0.22%), Tsimshian (19.1%, a difference of 0.26%), and Kenyan (19.1%, a difference of 0.30%).
| Demographics | Rating | Rank | 3 or more Vehicles in Household |
| Immigrants | Zimbabwe | 25.5 /100 | #190 | Fair 19.1% |
| South American Indians | 25.4 /100 | #191 | Fair 19.1% |
| Kenyans | 24.7 /100 | #192 | Fair 19.1% |
| Tsimshian | 24.4 /100 | #193 | Fair 19.1% |
| Serbians | 24.0 /100 | #194 | Fair 19.1% |
| Immigrants | Moldova | 23.6 /100 | #195 | Fair 19.1% |
| Central American Indians | 22.2 /100 | #196 | Fair 19.0% |
| Immigrants | Japan | 22.0 /100 | #197 | Fair 19.0% |
| Egyptians | 19.5 /100 | #198 | Poor 19.0% |
| Immigrants | Norway | 19.0 /100 | #199 | Poor 19.0% |
| Argentineans | 18.2 /100 | #200 | Poor 18.9% |
| Arabs | 17.7 /100 | #201 | Poor 18.9% |
| Immigrants | Austria | 15.4 /100 | #202 | Poor 18.9% |
| Tohono O'odham | 14.8 /100 | #203 | Poor 18.9% |
| Immigrants | Romania | 14.6 /100 | #204 | Poor 18.9% |
Demographics Similar to Nonimmigrants by 3 or more Vehicles in Household
In terms of 3 or more vehicles in household, the demographic groups most similar to Nonimmigrants are Japanese (21.8%, a difference of 0.040%), Irish (21.8%, a difference of 0.070%), Immigrants from Oceania (21.8%, a difference of 0.15%), Salvadoran (21.8%, a difference of 0.16%), and Czechoslovakian (21.7%, a difference of 0.20%).
| Demographics | Rating | Rank | 3 or more Vehicles in Household |
| Creek | 99.9 /100 | #69 | Exceptional 21.9% |
| Bangladeshis | 99.8 /100 | #70 | Exceptional 21.9% |
| Potawatomi | 99.8 /100 | #71 | Exceptional 21.9% |
| Portuguese | 99.8 /100 | #72 | Exceptional 21.8% |
| Salvadorans | 99.8 /100 | #73 | Exceptional 21.8% |
| Immigrants | Oceania | 99.8 /100 | #74 | Exceptional 21.8% |
| Japanese | 99.8 /100 | #75 | Exceptional 21.8% |
| Immigrants | Nonimmigrants | 99.8 /100 | #76 | Exceptional 21.8% |
| Irish | 99.8 /100 | #77 | Exceptional 21.8% |
| Czechoslovakians | 99.8 /100 | #78 | Exceptional 21.7% |
| Assyrians/Chaldeans/Syriacs | 99.8 /100 | #79 | Exceptional 21.7% |
| Afghans | 99.7 /100 | #80 | Exceptional 21.7% |
| Celtics | 99.7 /100 | #81 | Exceptional 21.7% |
| Immigrants | El Salvador | 99.6 /100 | #82 | Exceptional 21.5% |
| Chippewa | 99.6 /100 | #83 | Exceptional 21.5% |