Immigrants from Japan vs Indonesian 3 or more Vehicles in Household
COMPARE
Immigrants from Japan
Indonesian
3 or more Vehicles in Household
3 or more Vehicles in Household Comparison
Immigrants from Japan
Indonesians
19.0%
3 OR MORE VEHICLES IN HOUSEHOLD
22.0/ 100
METRIC RATING
197th/ 347
METRIC RANK
18.3%
3 OR MORE VEHICLES IN HOUSEHOLD
3.5/ 100
METRIC RATING
237th/ 347
METRIC RANK
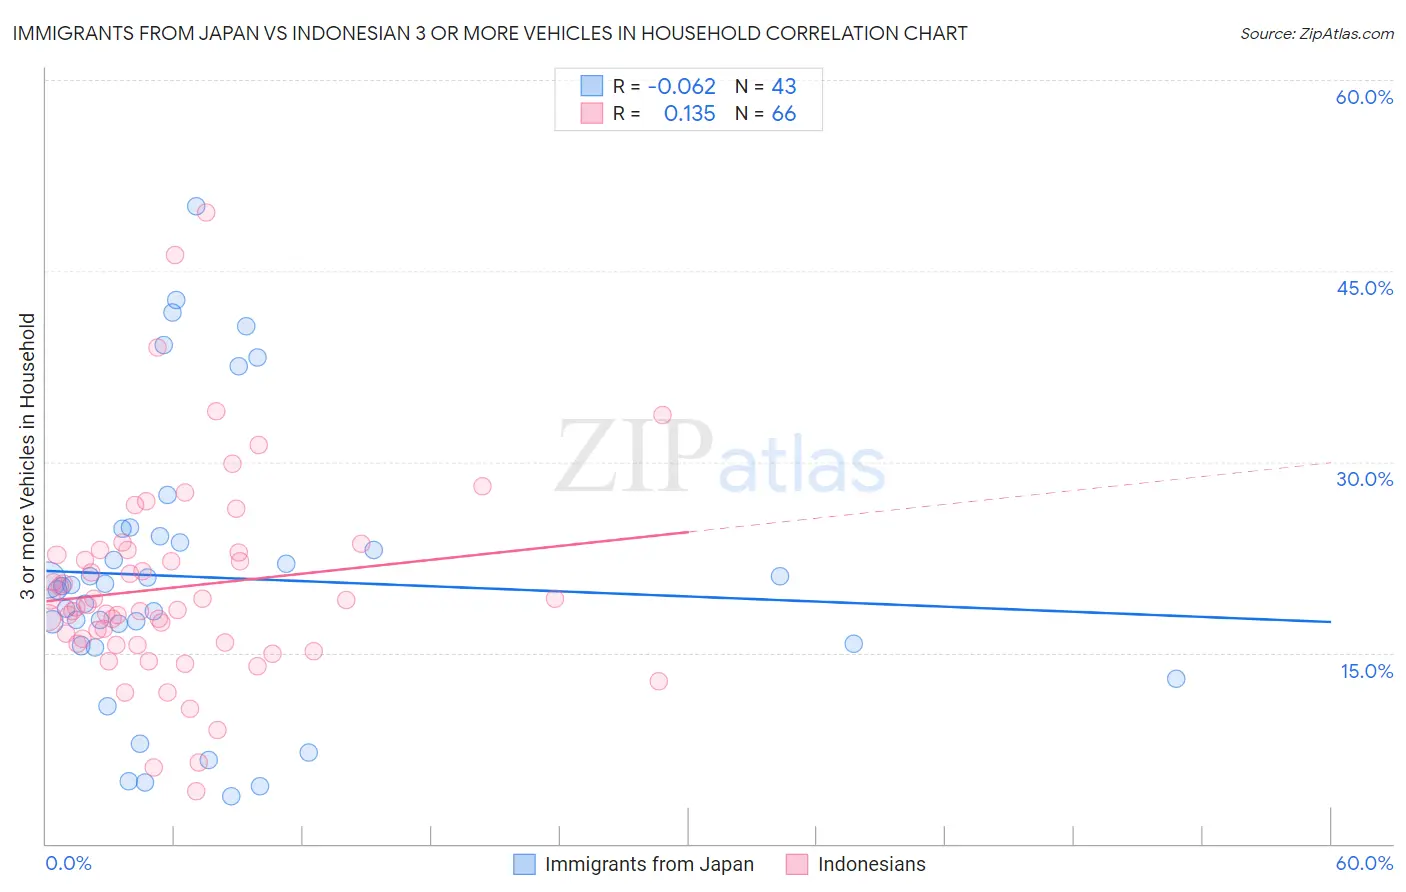
Immigrants from Japan vs Indonesian 3 or more Vehicles in Household Correlation Chart
The statistical analysis conducted on geographies consisting of 339,875,755 people shows a slight negative correlation between the proportion of Immigrants from Japan and percentage of households with 3 or more vehicles available in the United States with a correlation coefficient (R) of -0.062 and weighted average of 19.0%. Similarly, the statistical analysis conducted on geographies consisting of 162,622,478 people shows a poor positive correlation between the proportion of Indonesians and percentage of households with 3 or more vehicles available in the United States with a correlation coefficient (R) of 0.135 and weighted average of 18.3%, a difference of 4.1%.
3 or more Vehicles in Household Correlation Summary
| Measurement | Immigrants from Japan | Indonesian |
| Minimum | 3.8% | 4.1% |
| Maximum | 50.1% | 49.6% |
| Range | 46.3% | 45.5% |
| Mean | 20.9% | 20.2% |
| Median | 20.3% | 18.7% |
| Interquartile 25% (IQ1) | 15.6% | 15.7% |
| Interquartile 75% (IQ3) | 24.2% | 22.9% |
| Interquartile Range (IQR) | 8.6% | 7.2% |
| Standard Deviation (Sample) | 11.0% | 8.1% |
| Standard Deviation (Population) | 10.9% | 8.0% |
Similar Demographics by 3 or more Vehicles in Household
Demographics Similar to Immigrants from Japan by 3 or more Vehicles in Household
In terms of 3 or more vehicles in household, the demographic groups most similar to Immigrants from Japan are Central American Indian (19.0%, a difference of 0.030%), Immigrants from Moldova (19.1%, a difference of 0.18%), Serbian (19.1%, a difference of 0.22%), Tsimshian (19.1%, a difference of 0.26%), and Kenyan (19.1%, a difference of 0.30%).
| Demographics | Rating | Rank | 3 or more Vehicles in Household |
| Immigrants | Zimbabwe | 25.5 /100 | #190 | Fair 19.1% |
| South American Indians | 25.4 /100 | #191 | Fair 19.1% |
| Kenyans | 24.7 /100 | #192 | Fair 19.1% |
| Tsimshian | 24.4 /100 | #193 | Fair 19.1% |
| Serbians | 24.0 /100 | #194 | Fair 19.1% |
| Immigrants | Moldova | 23.6 /100 | #195 | Fair 19.1% |
| Central American Indians | 22.2 /100 | #196 | Fair 19.0% |
| Immigrants | Japan | 22.0 /100 | #197 | Fair 19.0% |
| Egyptians | 19.5 /100 | #198 | Poor 19.0% |
| Immigrants | Norway | 19.0 /100 | #199 | Poor 19.0% |
| Argentineans | 18.2 /100 | #200 | Poor 18.9% |
| Arabs | 17.7 /100 | #201 | Poor 18.9% |
| Immigrants | Austria | 15.4 /100 | #202 | Poor 18.9% |
| Tohono O'odham | 14.8 /100 | #203 | Poor 18.9% |
| Immigrants | Romania | 14.6 /100 | #204 | Poor 18.9% |
Demographics Similar to Indonesians by 3 or more Vehicles in Household
In terms of 3 or more vehicles in household, the demographic groups most similar to Indonesians are Immigrants from Malaysia (18.3%, a difference of 0.040%), Sierra Leonean (18.3%, a difference of 0.23%), Immigrants from Honduras (18.2%, a difference of 0.23%), Immigrants from Middle Africa (18.2%, a difference of 0.24%), and Immigrants from China (18.2%, a difference of 0.36%).
| Demographics | Rating | Rank | 3 or more Vehicles in Household |
| Immigrants | Western Asia | 4.8 /100 | #230 | Tragic 18.4% |
| Immigrants | Belgium | 4.8 /100 | #231 | Tragic 18.4% |
| Immigrants | Uganda | 4.6 /100 | #232 | Tragic 18.4% |
| Hondurans | 4.6 /100 | #233 | Tragic 18.4% |
| Immigrants | North Macedonia | 4.4 /100 | #234 | Tragic 18.4% |
| Sierra Leoneans | 3.9 /100 | #235 | Tragic 18.3% |
| Immigrants | Malaysia | 3.6 /100 | #236 | Tragic 18.3% |
| Indonesians | 3.5 /100 | #237 | Tragic 18.3% |
| Immigrants | Honduras | 3.1 /100 | #238 | Tragic 18.2% |
| Immigrants | Middle Africa | 3.1 /100 | #239 | Tragic 18.2% |
| Immigrants | China | 2.9 /100 | #240 | Tragic 18.2% |
| Africans | 2.7 /100 | #241 | Tragic 18.2% |
| Hopi | 2.5 /100 | #242 | Tragic 18.2% |
| Immigrants | Europe | 2.4 /100 | #243 | Tragic 18.1% |
| Mongolians | 2.3 /100 | #244 | Tragic 18.1% |