Immigrants from Japan vs Immigrants from Cambodia 3 or more Vehicles in Household
COMPARE
Immigrants from Japan
Immigrants from Cambodia
3 or more Vehicles in Household
3 or more Vehicles in Household Comparison
Immigrants from Japan
Immigrants from Cambodia
19.0%
3 OR MORE VEHICLES IN HOUSEHOLD
22.0/ 100
METRIC RATING
197th/ 347
METRIC RANK
21.1%
3 OR MORE VEHICLES IN HOUSEHOLD
98.6/ 100
METRIC RATING
94th/ 347
METRIC RANK
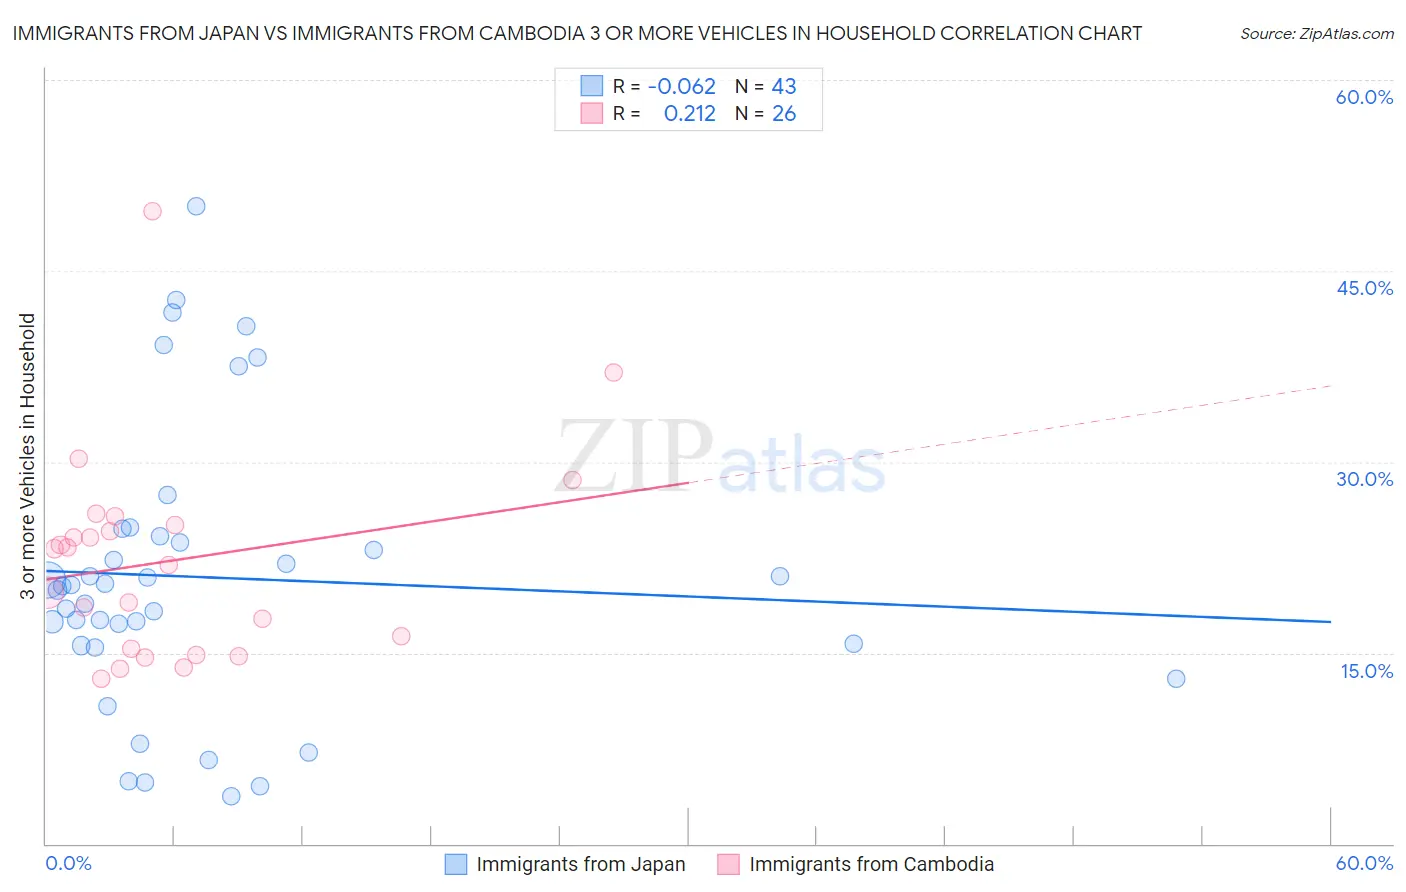
Immigrants from Japan vs Immigrants from Cambodia 3 or more Vehicles in Household Correlation Chart
The statistical analysis conducted on geographies consisting of 339,875,755 people shows a slight negative correlation between the proportion of Immigrants from Japan and percentage of households with 3 or more vehicles available in the United States with a correlation coefficient (R) of -0.062 and weighted average of 19.0%. Similarly, the statistical analysis conducted on geographies consisting of 205,124,978 people shows a weak positive correlation between the proportion of Immigrants from Cambodia and percentage of households with 3 or more vehicles available in the United States with a correlation coefficient (R) of 0.212 and weighted average of 21.1%, a difference of 10.7%.
3 or more Vehicles in Household Correlation Summary
| Measurement | Immigrants from Japan | Immigrants from Cambodia |
| Minimum | 3.8% | 13.0% |
| Maximum | 50.1% | 49.7% |
| Range | 46.3% | 36.7% |
| Mean | 20.9% | 22.2% |
| Median | 20.3% | 22.5% |
| Interquartile 25% (IQ1) | 15.6% | 15.4% |
| Interquartile 75% (IQ3) | 24.2% | 25.0% |
| Interquartile Range (IQR) | 8.6% | 9.6% |
| Standard Deviation (Sample) | 11.0% | 8.1% |
| Standard Deviation (Population) | 10.9% | 8.0% |
Similar Demographics by 3 or more Vehicles in Household
Demographics Similar to Immigrants from Japan by 3 or more Vehicles in Household
In terms of 3 or more vehicles in household, the demographic groups most similar to Immigrants from Japan are Central American Indian (19.0%, a difference of 0.030%), Immigrants from Moldova (19.1%, a difference of 0.18%), Serbian (19.1%, a difference of 0.22%), Tsimshian (19.1%, a difference of 0.26%), and Kenyan (19.1%, a difference of 0.30%).
| Demographics | Rating | Rank | 3 or more Vehicles in Household |
| Immigrants | Zimbabwe | 25.5 /100 | #190 | Fair 19.1% |
| South American Indians | 25.4 /100 | #191 | Fair 19.1% |
| Kenyans | 24.7 /100 | #192 | Fair 19.1% |
| Tsimshian | 24.4 /100 | #193 | Fair 19.1% |
| Serbians | 24.0 /100 | #194 | Fair 19.1% |
| Immigrants | Moldova | 23.6 /100 | #195 | Fair 19.1% |
| Central American Indians | 22.2 /100 | #196 | Fair 19.0% |
| Immigrants | Japan | 22.0 /100 | #197 | Fair 19.0% |
| Egyptians | 19.5 /100 | #198 | Poor 19.0% |
| Immigrants | Norway | 19.0 /100 | #199 | Poor 19.0% |
| Argentineans | 18.2 /100 | #200 | Poor 18.9% |
| Arabs | 17.7 /100 | #201 | Poor 18.9% |
| Immigrants | Austria | 15.4 /100 | #202 | Poor 18.9% |
| Tohono O'odham | 14.8 /100 | #203 | Poor 18.9% |
| Immigrants | Romania | 14.6 /100 | #204 | Poor 18.9% |
Demographics Similar to Immigrants from Cambodia by 3 or more Vehicles in Household
In terms of 3 or more vehicles in household, the demographic groups most similar to Immigrants from Cambodia are Pakistani (21.0%, a difference of 0.14%), Immigrants from Indonesia (21.1%, a difference of 0.23%), Cree (21.0%, a difference of 0.23%), Canadian (21.0%, a difference of 0.34%), and Hmong (21.0%, a difference of 0.40%).
| Demographics | Rating | Rank | 3 or more Vehicles in Household |
| Immigrants | Azores | 99.5 /100 | #87 | Exceptional 21.5% |
| French | 99.4 /100 | #88 | Exceptional 21.4% |
| Marshallese | 99.2 /100 | #89 | Exceptional 21.3% |
| Immigrants | Afghanistan | 99.1 /100 | #90 | Exceptional 21.2% |
| Belgians | 98.9 /100 | #91 | Exceptional 21.2% |
| Apache | 98.9 /100 | #92 | Exceptional 21.2% |
| Immigrants | Indonesia | 98.8 /100 | #93 | Exceptional 21.1% |
| Immigrants | Cambodia | 98.6 /100 | #94 | Exceptional 21.1% |
| Pakistanis | 98.5 /100 | #95 | Exceptional 21.0% |
| Cree | 98.4 /100 | #96 | Exceptional 21.0% |
| Canadians | 98.3 /100 | #97 | Exceptional 21.0% |
| Hmong | 98.2 /100 | #98 | Exceptional 21.0% |
| Alaska Natives | 98.2 /100 | #99 | Exceptional 21.0% |
| Comanche | 98.2 /100 | #100 | Exceptional 21.0% |
| Blackfeet | 97.9 /100 | #101 | Exceptional 20.9% |