Czech vs Nonimmigrants 3 or more Vehicles in Household
COMPARE
Czech
Nonimmigrants
3 or more Vehicles in Household
3 or more Vehicles in Household Comparison
Czechs
Nonimmigrants
22.5%
3 OR MORE VEHICLES IN HOUSEHOLD
100.0/ 100
METRIC RATING
53rd/ 347
METRIC RANK
21.8%
3 OR MORE VEHICLES IN HOUSEHOLD
99.8/ 100
METRIC RATING
76th/ 347
METRIC RANK
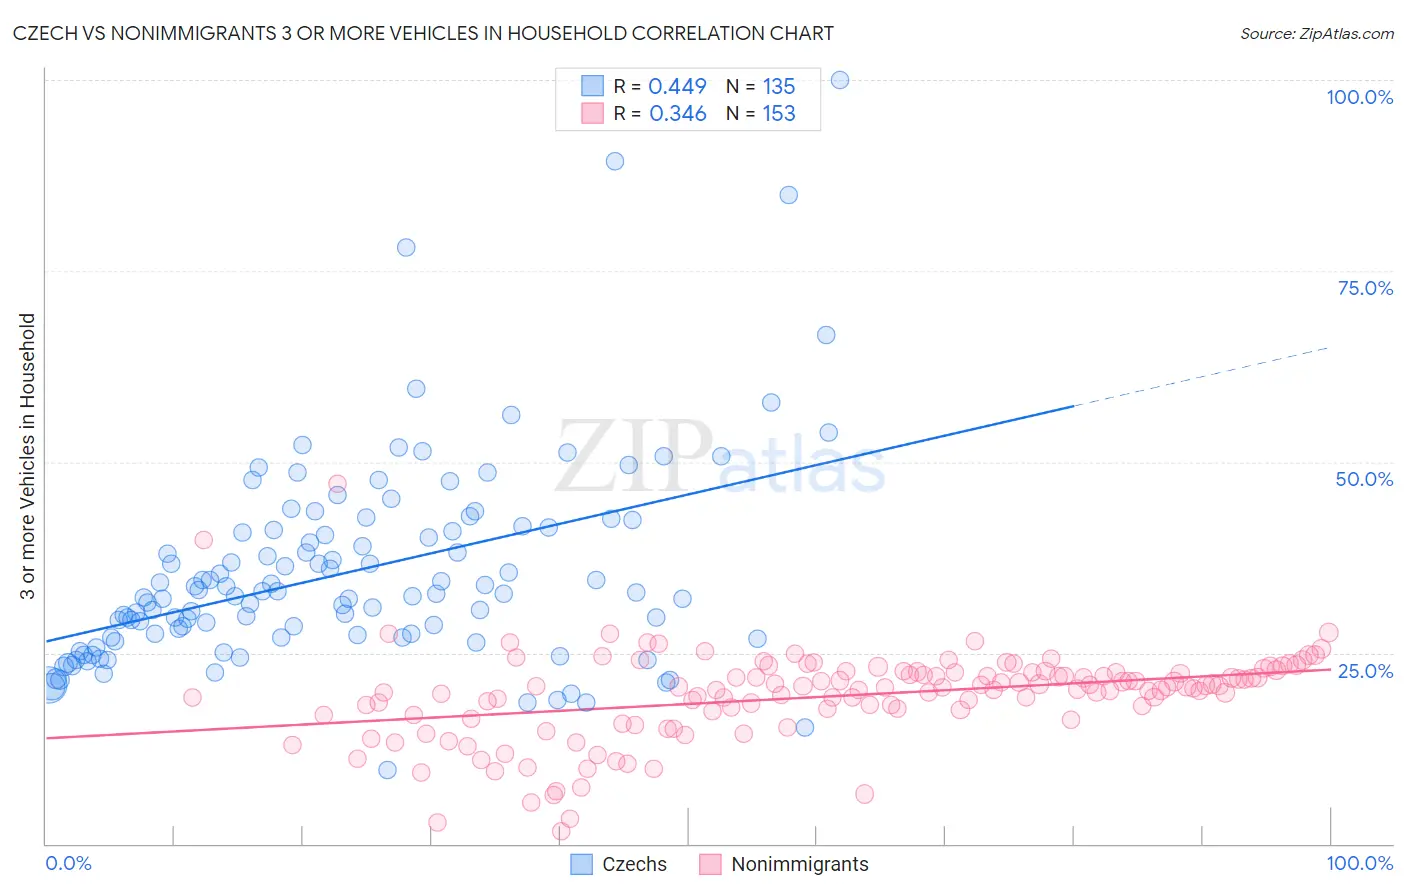
Czech vs Nonimmigrants 3 or more Vehicles in Household Correlation Chart
The statistical analysis conducted on geographies consisting of 484,303,845 people shows a moderate positive correlation between the proportion of Czechs and percentage of households with 3 or more vehicles available in the United States with a correlation coefficient (R) of 0.449 and weighted average of 22.5%. Similarly, the statistical analysis conducted on geographies consisting of 584,058,560 people shows a mild positive correlation between the proportion of Nonimmigrants and percentage of households with 3 or more vehicles available in the United States with a correlation coefficient (R) of 0.346 and weighted average of 21.8%, a difference of 3.4%.
3 or more Vehicles in Household Correlation Summary
| Measurement | Czech | Nonimmigrants |
| Minimum | 9.6% | 1.6% |
| Maximum | 100.0% | 47.1% |
| Range | 90.4% | 45.5% |
| Mean | 35.5% | 19.3% |
| Median | 32.7% | 20.4% |
| Interquartile 25% (IQ1) | 27.0% | 17.2% |
| Interquartile 75% (IQ3) | 41.0% | 22.5% |
| Interquartile Range (IQR) | 14.0% | 5.3% |
| Standard Deviation (Sample) | 13.6% | 5.9% |
| Standard Deviation (Population) | 13.6% | 5.9% |
Similar Demographics by 3 or more Vehicles in Household
Demographics Similar to Czechs by 3 or more Vehicles in Household
In terms of 3 or more vehicles in household, the demographic groups most similar to Czechs are Crow (22.5%, a difference of 0.21%), Welsh (22.6%, a difference of 0.25%), White/Caucasian (22.6%, a difference of 0.29%), Sioux (22.6%, a difference of 0.30%), and Scotch-Irish (22.6%, a difference of 0.36%).
| Demographics | Rating | Rank | 3 or more Vehicles in Household |
| Americans | 100.0 /100 | #46 | Exceptional 22.6% |
| Malaysians | 100.0 /100 | #47 | Exceptional 22.6% |
| Scottish | 100.0 /100 | #48 | Exceptional 22.6% |
| Scotch-Irish | 100.0 /100 | #49 | Exceptional 22.6% |
| Sioux | 100.0 /100 | #50 | Exceptional 22.6% |
| Whites/Caucasians | 100.0 /100 | #51 | Exceptional 22.6% |
| Welsh | 100.0 /100 | #52 | Exceptional 22.6% |
| Czechs | 100.0 /100 | #53 | Exceptional 22.5% |
| Crow | 100.0 /100 | #54 | Exceptional 22.5% |
| Immigrants | Laos | 100.0 /100 | #55 | Exceptional 22.4% |
| Hispanics or Latinos | 100.0 /100 | #56 | Exceptional 22.4% |
| Pennsylvania Germans | 100.0 /100 | #57 | Exceptional 22.3% |
| Spaniards | 100.0 /100 | #58 | Exceptional 22.3% |
| Navajo | 100.0 /100 | #59 | Exceptional 22.3% |
| Finns | 99.9 /100 | #60 | Exceptional 22.3% |
Demographics Similar to Nonimmigrants by 3 or more Vehicles in Household
In terms of 3 or more vehicles in household, the demographic groups most similar to Nonimmigrants are Japanese (21.8%, a difference of 0.040%), Irish (21.8%, a difference of 0.070%), Immigrants from Oceania (21.8%, a difference of 0.15%), Salvadoran (21.8%, a difference of 0.16%), and Czechoslovakian (21.7%, a difference of 0.20%).
| Demographics | Rating | Rank | 3 or more Vehicles in Household |
| Creek | 99.9 /100 | #69 | Exceptional 21.9% |
| Bangladeshis | 99.8 /100 | #70 | Exceptional 21.9% |
| Potawatomi | 99.8 /100 | #71 | Exceptional 21.9% |
| Portuguese | 99.8 /100 | #72 | Exceptional 21.8% |
| Salvadorans | 99.8 /100 | #73 | Exceptional 21.8% |
| Immigrants | Oceania | 99.8 /100 | #74 | Exceptional 21.8% |
| Japanese | 99.8 /100 | #75 | Exceptional 21.8% |
| Immigrants | Nonimmigrants | 99.8 /100 | #76 | Exceptional 21.8% |
| Irish | 99.8 /100 | #77 | Exceptional 21.8% |
| Czechoslovakians | 99.8 /100 | #78 | Exceptional 21.7% |
| Assyrians/Chaldeans/Syriacs | 99.8 /100 | #79 | Exceptional 21.7% |
| Afghans | 99.7 /100 | #80 | Exceptional 21.7% |
| Celtics | 99.7 /100 | #81 | Exceptional 21.7% |
| Immigrants | El Salvador | 99.6 /100 | #82 | Exceptional 21.5% |
| Chippewa | 99.6 /100 | #83 | Exceptional 21.5% |