Assyrian/Chaldean/Syriac vs Immigrants from Cambodia 3 or more Vehicles in Household
COMPARE
Assyrian/Chaldean/Syriac
Immigrants from Cambodia
3 or more Vehicles in Household
3 or more Vehicles in Household Comparison
Assyrians/Chaldeans/Syriacs
Immigrants from Cambodia
21.7%
3 OR MORE VEHICLES IN HOUSEHOLD
99.8/ 100
METRIC RATING
79th/ 347
METRIC RANK
21.1%
3 OR MORE VEHICLES IN HOUSEHOLD
98.6/ 100
METRIC RATING
94th/ 347
METRIC RANK
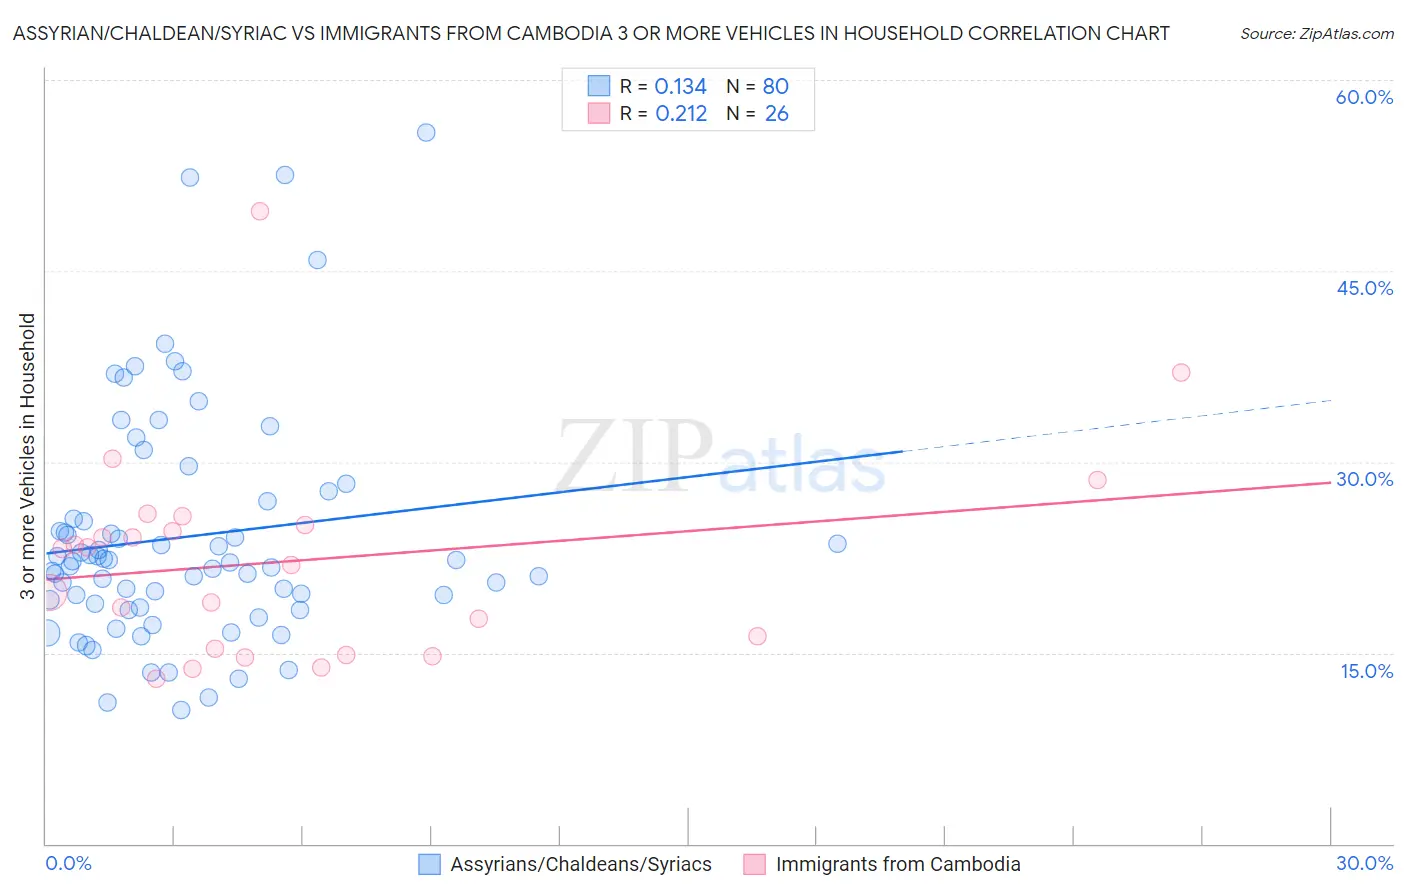
Assyrian/Chaldean/Syriac vs Immigrants from Cambodia 3 or more Vehicles in Household Correlation Chart
The statistical analysis conducted on geographies consisting of 110,285,741 people shows a poor positive correlation between the proportion of Assyrians/Chaldeans/Syriacs and percentage of households with 3 or more vehicles available in the United States with a correlation coefficient (R) of 0.134 and weighted average of 21.7%. Similarly, the statistical analysis conducted on geographies consisting of 205,124,978 people shows a weak positive correlation between the proportion of Immigrants from Cambodia and percentage of households with 3 or more vehicles available in the United States with a correlation coefficient (R) of 0.212 and weighted average of 21.1%, a difference of 3.1%.
3 or more Vehicles in Household Correlation Summary
| Measurement | Assyrian/Chaldean/Syriac | Immigrants from Cambodia |
| Minimum | 10.5% | 13.0% |
| Maximum | 55.9% | 49.7% |
| Range | 45.4% | 36.7% |
| Mean | 24.1% | 22.2% |
| Median | 22.1% | 22.5% |
| Interquartile 25% (IQ1) | 18.7% | 15.4% |
| Interquartile 75% (IQ3) | 26.2% | 25.0% |
| Interquartile Range (IQR) | 7.4% | 9.6% |
| Standard Deviation (Sample) | 9.2% | 8.1% |
| Standard Deviation (Population) | 9.1% | 8.0% |
Demographics Similar to Assyrians/Chaldeans/Syriacs and Immigrants from Cambodia by 3 or more Vehicles in Household
In terms of 3 or more vehicles in household, the demographic groups most similar to Assyrians/Chaldeans/Syriacs are Czechoslovakian (21.7%, a difference of 0.0%), Irish (21.8%, a difference of 0.13%), Nonimmigrants (21.8%, a difference of 0.20%), Afghan (21.7%, a difference of 0.20%), and Celtic (21.7%, a difference of 0.28%). Similarly, the demographic groups most similar to Immigrants from Cambodia are Pakistani (21.0%, a difference of 0.14%), Immigrants from Indonesia (21.1%, a difference of 0.23%), Cree (21.0%, a difference of 0.23%), Apache (21.2%, a difference of 0.43%), and Belgian (21.2%, a difference of 0.51%).
| Demographics | Rating | Rank | 3 or more Vehicles in Household |
| Immigrants | Nonimmigrants | 99.8 /100 | #76 | Exceptional 21.8% |
| Irish | 99.8 /100 | #77 | Exceptional 21.8% |
| Czechoslovakians | 99.8 /100 | #78 | Exceptional 21.7% |
| Assyrians/Chaldeans/Syriacs | 99.8 /100 | #79 | Exceptional 21.7% |
| Afghans | 99.7 /100 | #80 | Exceptional 21.7% |
| Celtics | 99.7 /100 | #81 | Exceptional 21.7% |
| Immigrants | El Salvador | 99.6 /100 | #82 | Exceptional 21.5% |
| Chippewa | 99.6 /100 | #83 | Exceptional 21.5% |
| Icelanders | 99.6 /100 | #84 | Exceptional 21.5% |
| Laotians | 99.6 /100 | #85 | Exceptional 21.5% |
| Delaware | 99.6 /100 | #86 | Exceptional 21.5% |
| Immigrants | Azores | 99.5 /100 | #87 | Exceptional 21.5% |
| French | 99.4 /100 | #88 | Exceptional 21.4% |
| Marshallese | 99.2 /100 | #89 | Exceptional 21.3% |
| Immigrants | Afghanistan | 99.1 /100 | #90 | Exceptional 21.2% |
| Belgians | 98.9 /100 | #91 | Exceptional 21.2% |
| Apache | 98.9 /100 | #92 | Exceptional 21.2% |
| Immigrants | Indonesia | 98.8 /100 | #93 | Exceptional 21.1% |
| Immigrants | Cambodia | 98.6 /100 | #94 | Exceptional 21.1% |
| Pakistanis | 98.5 /100 | #95 | Exceptional 21.0% |
| Cree | 98.4 /100 | #96 | Exceptional 21.0% |