Immigrants from Ghana vs Immigrants from Cambodia 3 or more Vehicles in Household
COMPARE
Immigrants from Ghana
Immigrants from Cambodia
3 or more Vehicles in Household
3 or more Vehicles in Household Comparison
Immigrants from Ghana
Immigrants from Cambodia
16.2%
3 OR MORE VEHICLES IN HOUSEHOLD
0.0/ 100
METRIC RATING
307th/ 347
METRIC RANK
21.1%
3 OR MORE VEHICLES IN HOUSEHOLD
98.6/ 100
METRIC RATING
94th/ 347
METRIC RANK
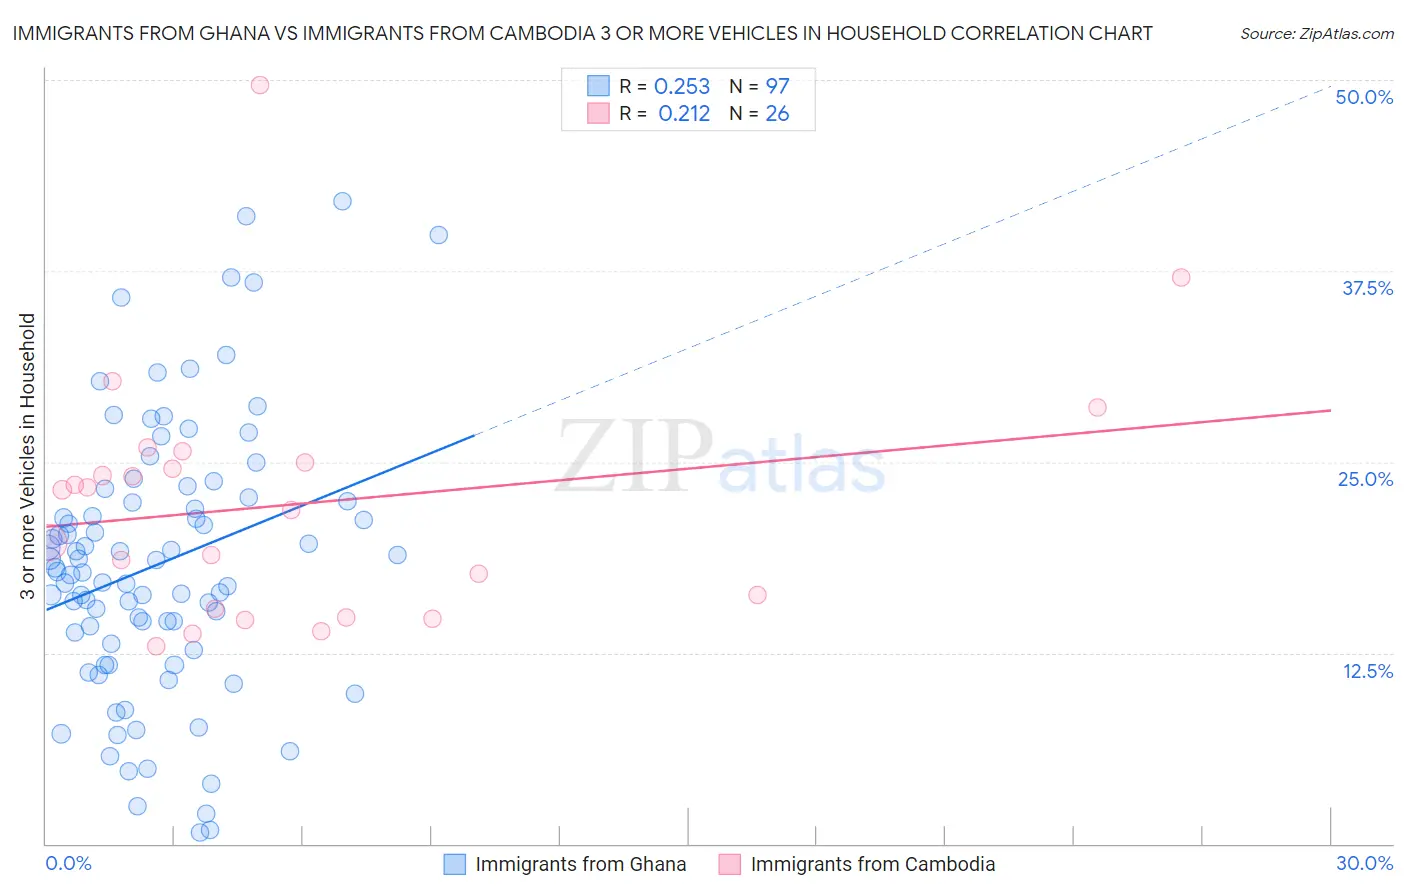
Immigrants from Ghana vs Immigrants from Cambodia 3 or more Vehicles in Household Correlation Chart
The statistical analysis conducted on geographies consisting of 199,771,460 people shows a weak positive correlation between the proportion of Immigrants from Ghana and percentage of households with 3 or more vehicles available in the United States with a correlation coefficient (R) of 0.253 and weighted average of 16.2%. Similarly, the statistical analysis conducted on geographies consisting of 205,124,978 people shows a weak positive correlation between the proportion of Immigrants from Cambodia and percentage of households with 3 or more vehicles available in the United States with a correlation coefficient (R) of 0.212 and weighted average of 21.1%, a difference of 30.4%.
3 or more Vehicles in Household Correlation Summary
| Measurement | Immigrants from Ghana | Immigrants from Cambodia |
| Minimum | 0.70% | 13.0% |
| Maximum | 42.0% | 49.7% |
| Range | 41.3% | 36.7% |
| Mean | 18.3% | 22.2% |
| Median | 17.8% | 22.5% |
| Interquartile 25% (IQ1) | 12.9% | 15.4% |
| Interquartile 75% (IQ3) | 22.6% | 25.0% |
| Interquartile Range (IQR) | 9.7% | 9.6% |
| Standard Deviation (Sample) | 8.8% | 8.1% |
| Standard Deviation (Population) | 8.8% | 8.0% |
Similar Demographics by 3 or more Vehicles in Household
Demographics Similar to Immigrants from Ghana by 3 or more Vehicles in Household
In terms of 3 or more vehicles in household, the demographic groups most similar to Immigrants from Ghana are Somali (16.2%, a difference of 0.15%), Houma (16.1%, a difference of 0.59%), Immigrants from Morocco (16.3%, a difference of 0.96%), Ghanaian (16.4%, a difference of 1.2%), and Immigrants from Somalia (15.9%, a difference of 1.5%).
| Demographics | Rating | Rank | 3 or more Vehicles in Household |
| Cypriots | 0.0 /100 | #300 | Tragic 16.6% |
| Paraguayans | 0.0 /100 | #301 | Tragic 16.6% |
| Immigrants | Greece | 0.0 /100 | #302 | Tragic 16.5% |
| Immigrants | Serbia | 0.0 /100 | #303 | Tragic 16.4% |
| Ghanaians | 0.0 /100 | #304 | Tragic 16.4% |
| Immigrants | Morocco | 0.0 /100 | #305 | Tragic 16.3% |
| Somalis | 0.0 /100 | #306 | Tragic 16.2% |
| Immigrants | Ghana | 0.0 /100 | #307 | Tragic 16.2% |
| Houma | 0.0 /100 | #308 | Tragic 16.1% |
| Immigrants | Somalia | 0.0 /100 | #309 | Tragic 15.9% |
| Moroccans | 0.0 /100 | #310 | Tragic 15.9% |
| Albanians | 0.0 /100 | #311 | Tragic 15.8% |
| Puerto Ricans | 0.0 /100 | #312 | Tragic 15.6% |
| Immigrants | Israel | 0.0 /100 | #313 | Tragic 15.6% |
| Immigrants | Belarus | 0.0 /100 | #314 | Tragic 15.5% |
Demographics Similar to Immigrants from Cambodia by 3 or more Vehicles in Household
In terms of 3 or more vehicles in household, the demographic groups most similar to Immigrants from Cambodia are Pakistani (21.0%, a difference of 0.14%), Immigrants from Indonesia (21.1%, a difference of 0.23%), Cree (21.0%, a difference of 0.23%), Canadian (21.0%, a difference of 0.34%), and Hmong (21.0%, a difference of 0.40%).
| Demographics | Rating | Rank | 3 or more Vehicles in Household |
| Immigrants | Azores | 99.5 /100 | #87 | Exceptional 21.5% |
| French | 99.4 /100 | #88 | Exceptional 21.4% |
| Marshallese | 99.2 /100 | #89 | Exceptional 21.3% |
| Immigrants | Afghanistan | 99.1 /100 | #90 | Exceptional 21.2% |
| Belgians | 98.9 /100 | #91 | Exceptional 21.2% |
| Apache | 98.9 /100 | #92 | Exceptional 21.2% |
| Immigrants | Indonesia | 98.8 /100 | #93 | Exceptional 21.1% |
| Immigrants | Cambodia | 98.6 /100 | #94 | Exceptional 21.1% |
| Pakistanis | 98.5 /100 | #95 | Exceptional 21.0% |
| Cree | 98.4 /100 | #96 | Exceptional 21.0% |
| Canadians | 98.3 /100 | #97 | Exceptional 21.0% |
| Hmong | 98.2 /100 | #98 | Exceptional 21.0% |
| Alaska Natives | 98.2 /100 | #99 | Exceptional 21.0% |
| Comanche | 98.2 /100 | #100 | Exceptional 21.0% |
| Blackfeet | 97.9 /100 | #101 | Exceptional 20.9% |