Hungarian vs Senegalese 1 or more Vehicles in Household
COMPARE
Hungarian
Senegalese
1 or more Vehicles in Household
1 or more Vehicles in Household Comparison
Hungarians
Senegalese
90.3%
1 OR MORE VEHICLES IN HOUSEHOLD
86.5/ 100
METRIC RATING
136th/ 347
METRIC RANK
80.4%
1 OR MORE VEHICLES IN HOUSEHOLD
0.0/ 100
METRIC RATING
325th/ 347
METRIC RANK
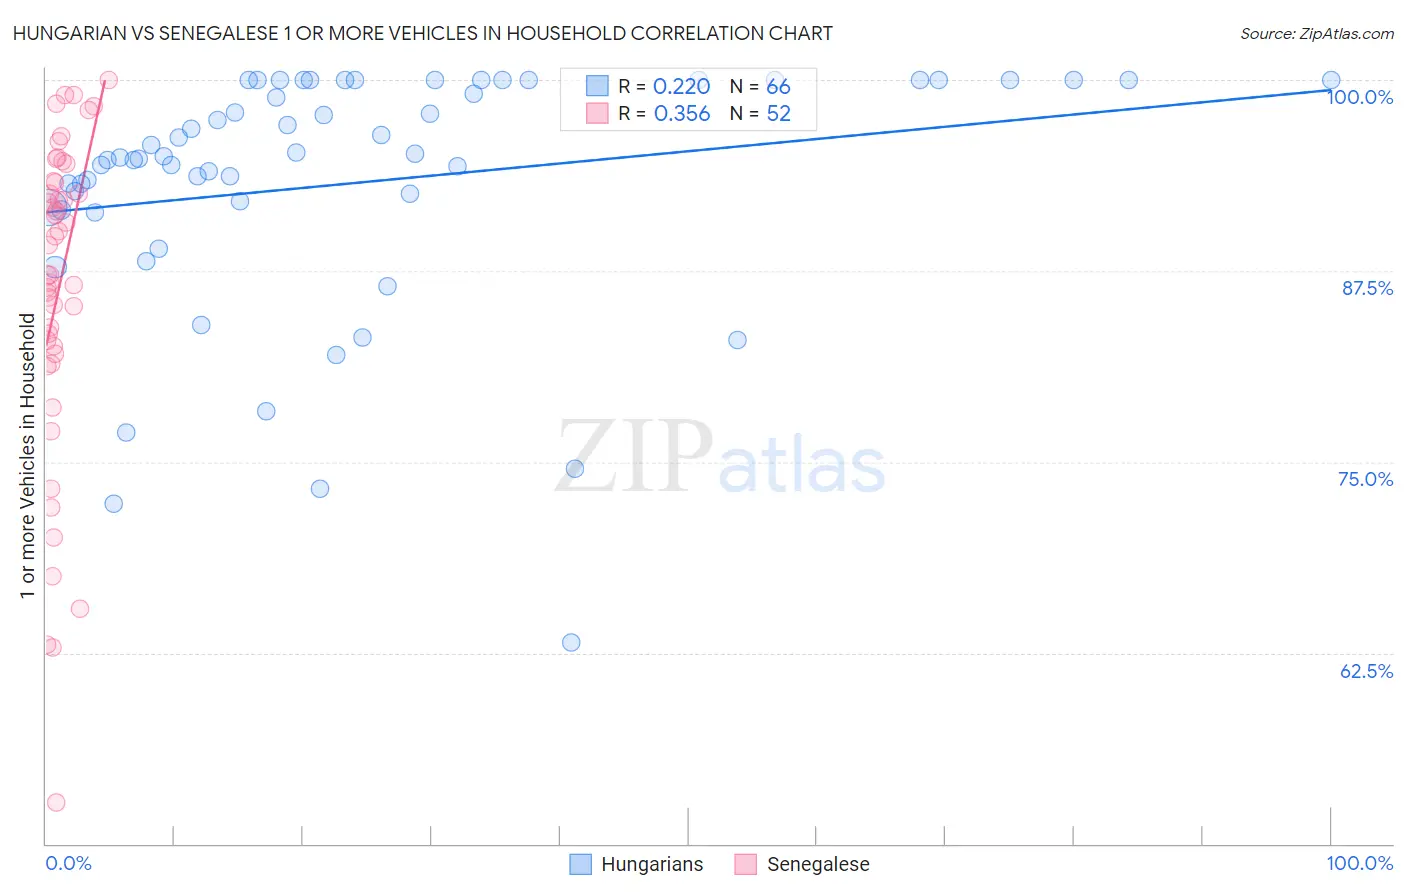
Hungarian vs Senegalese 1 or more Vehicles in Household Correlation Chart
The statistical analysis conducted on geographies consisting of 485,902,681 people shows a weak positive correlation between the proportion of Hungarians and percentage of households with 1 or more vehicles available in the United States with a correlation coefficient (R) of 0.220 and weighted average of 90.3%. Similarly, the statistical analysis conducted on geographies consisting of 78,083,411 people shows a mild positive correlation between the proportion of Senegalese and percentage of households with 1 or more vehicles available in the United States with a correlation coefficient (R) of 0.356 and weighted average of 80.4%, a difference of 12.4%.
1 or more Vehicles in Household Correlation Summary
| Measurement | Hungarian | Senegalese |
| Minimum | 63.1% | 52.7% |
| Maximum | 100.0% | 100.0% |
| Range | 36.9% | 47.3% |
| Mean | 93.2% | 86.2% |
| Median | 95.0% | 88.2% |
| Interquartile 25% (IQ1) | 91.7% | 82.3% |
| Interquartile 75% (IQ3) | 100.0% | 93.3% |
| Interquartile Range (IQR) | 8.3% | 11.0% |
| Standard Deviation (Sample) | 8.1% | 10.6% |
| Standard Deviation (Population) | 8.0% | 10.5% |
Similar Demographics by 1 or more Vehicles in Household
Demographics Similar to Hungarians by 1 or more Vehicles in Household
In terms of 1 or more vehicles in household, the demographic groups most similar to Hungarians are Latvian (90.3%, a difference of 0.010%), Syrian (90.3%, a difference of 0.010%), Kenyan (90.4%, a difference of 0.020%), Immigrants from Oceania (90.4%, a difference of 0.020%), and Estonian (90.3%, a difference of 0.030%).
| Demographics | Rating | Rank | 1 or more Vehicles in Household |
| Marshallese | 88.9 /100 | #129 | Excellent 90.4% |
| Nicaraguans | 88.8 /100 | #130 | Excellent 90.4% |
| Immigrants | Kenya | 88.5 /100 | #131 | Excellent 90.4% |
| Immigrants | South Africa | 88.1 /100 | #132 | Excellent 90.4% |
| Immigrants | Syria | 87.5 /100 | #133 | Excellent 90.4% |
| Kenyans | 87.0 /100 | #134 | Excellent 90.4% |
| Immigrants | Oceania | 86.9 /100 | #135 | Excellent 90.4% |
| Hungarians | 86.5 /100 | #136 | Excellent 90.3% |
| Latvians | 86.3 /100 | #137 | Excellent 90.3% |
| Syrians | 86.3 /100 | #138 | Excellent 90.3% |
| Estonians | 85.6 /100 | #139 | Excellent 90.3% |
| Sudanese | 85.2 /100 | #140 | Excellent 90.3% |
| Immigrants | Moldova | 83.1 /100 | #141 | Excellent 90.2% |
| Immigrants | Lithuania | 83.0 /100 | #142 | Excellent 90.2% |
| Immigrants | Bahamas | 81.5 /100 | #143 | Excellent 90.2% |
Demographics Similar to Senegalese by 1 or more Vehicles in Household
In terms of 1 or more vehicles in household, the demographic groups most similar to Senegalese are Immigrants from Caribbean (80.4%, a difference of 0.10%), Immigrants from Yemen (80.5%, a difference of 0.22%), Immigrants from West Indies (79.5%, a difference of 1.1%), Immigrants from Cabo Verde (81.6%, a difference of 1.5%), and Immigrants from Senegal (79.0%, a difference of 1.7%).
| Demographics | Rating | Rank | 1 or more Vehicles in Household |
| Immigrants | Ghana | 0.0 /100 | #318 | Tragic 83.4% |
| Immigrants | Belarus | 0.0 /100 | #319 | Tragic 83.3% |
| Soviet Union | 0.0 /100 | #320 | Tragic 82.7% |
| Jamaicans | 0.0 /100 | #321 | Tragic 82.1% |
| Immigrants | Cabo Verde | 0.0 /100 | #322 | Tragic 81.6% |
| Immigrants | Yemen | 0.0 /100 | #323 | Tragic 80.5% |
| Immigrants | Caribbean | 0.0 /100 | #324 | Tragic 80.4% |
| Senegalese | 0.0 /100 | #325 | Tragic 80.4% |
| Immigrants | West Indies | 0.0 /100 | #326 | Tragic 79.5% |
| Immigrants | Senegal | 0.0 /100 | #327 | Tragic 79.0% |
| Ecuadorians | 0.0 /100 | #328 | Tragic 77.9% |
| Immigrants | Dominica | 0.0 /100 | #329 | Tragic 77.8% |
| Immigrants | Trinidad and Tobago | 0.0 /100 | #330 | Tragic 76.8% |
| West Indians | 0.0 /100 | #331 | Tragic 76.4% |
| Trinidadians and Tobagonians | 0.0 /100 | #332 | Tragic 76.3% |