Immigrants from Eastern Asia vs Senegalese 1 or more Vehicles in Household
COMPARE
Immigrants from Eastern Asia
Senegalese
1 or more Vehicles in Household
1 or more Vehicles in Household Comparison
Immigrants from Eastern Asia
Senegalese
86.5%
1 OR MORE VEHICLES IN HOUSEHOLD
0.0/ 100
METRIC RATING
286th/ 347
METRIC RANK
80.4%
1 OR MORE VEHICLES IN HOUSEHOLD
0.0/ 100
METRIC RATING
325th/ 347
METRIC RANK
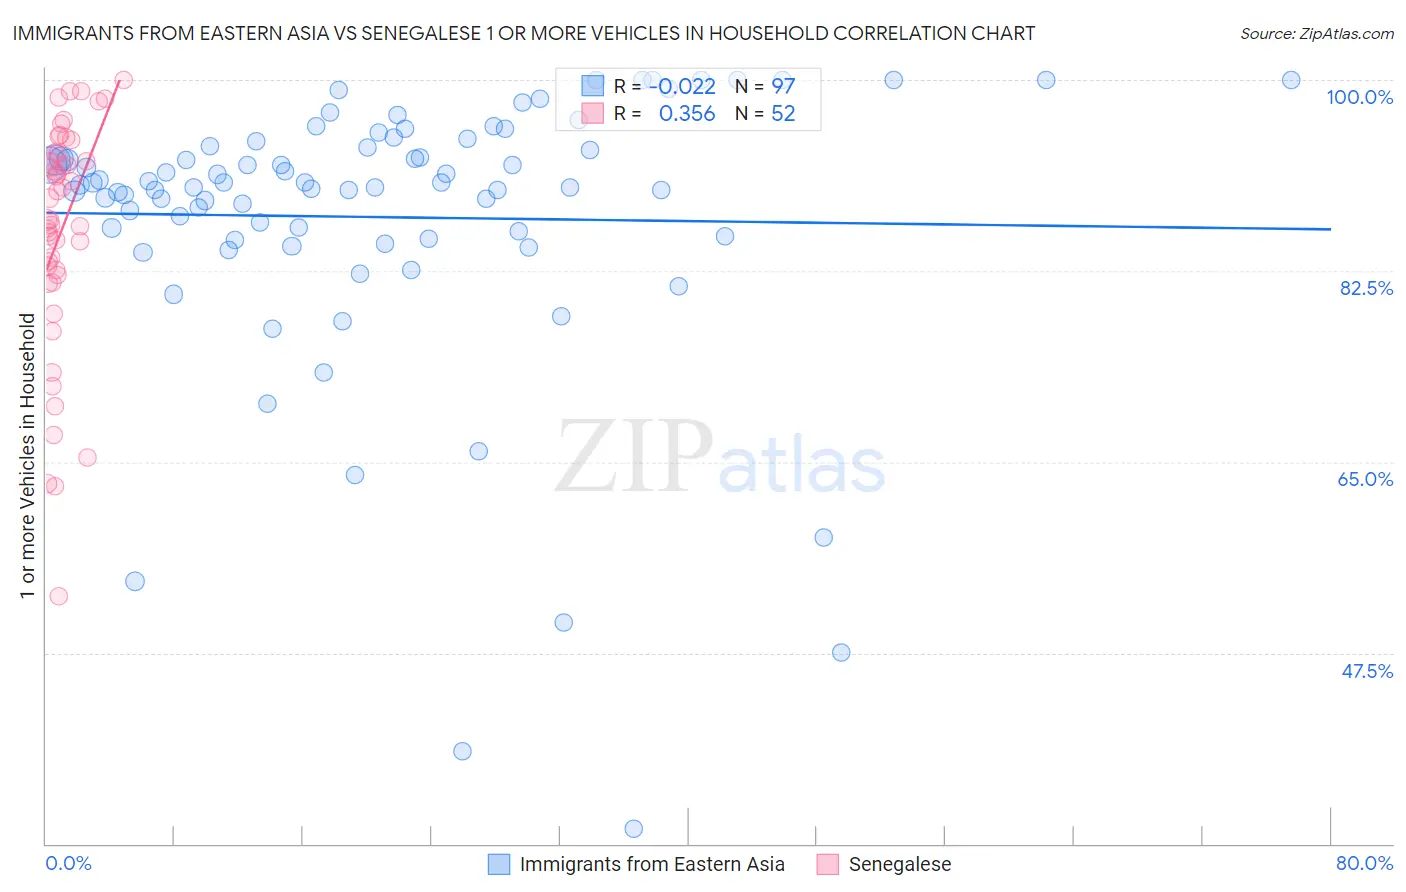
Immigrants from Eastern Asia vs Senegalese 1 or more Vehicles in Household Correlation Chart
The statistical analysis conducted on geographies consisting of 499,412,711 people shows no correlation between the proportion of Immigrants from Eastern Asia and percentage of households with 1 or more vehicles available in the United States with a correlation coefficient (R) of -0.022 and weighted average of 86.5%. Similarly, the statistical analysis conducted on geographies consisting of 78,083,411 people shows a mild positive correlation between the proportion of Senegalese and percentage of households with 1 or more vehicles available in the United States with a correlation coefficient (R) of 0.356 and weighted average of 80.4%, a difference of 7.7%.
1 or more Vehicles in Household Correlation Summary
| Measurement | Immigrants from Eastern Asia | Senegalese |
| Minimum | 31.4% | 52.7% |
| Maximum | 100.0% | 100.0% |
| Range | 68.6% | 47.3% |
| Mean | 87.4% | 86.2% |
| Median | 90.3% | 88.2% |
| Interquartile 25% (IQ1) | 85.6% | 82.3% |
| Interquartile 75% (IQ3) | 94.1% | 93.3% |
| Interquartile Range (IQR) | 8.6% | 11.0% |
| Standard Deviation (Sample) | 12.8% | 10.6% |
| Standard Deviation (Population) | 12.7% | 10.5% |
Similar Demographics by 1 or more Vehicles in Household
Demographics Similar to Immigrants from Eastern Asia by 1 or more Vehicles in Household
In terms of 1 or more vehicles in household, the demographic groups most similar to Immigrants from Eastern Asia are Immigrants from Kazakhstan (86.6%, a difference of 0.030%), Immigrants from Malaysia (86.5%, a difference of 0.080%), Hopi (86.4%, a difference of 0.15%), Immigrants from Ireland (86.4%, a difference of 0.16%), and Immigrants from Australia (86.4%, a difference of 0.21%).
| Demographics | Rating | Rank | 1 or more Vehicles in Household |
| Immigrants | Albania | 0.1 /100 | #279 | Tragic 87.1% |
| Immigrants | Croatia | 0.0 /100 | #280 | Tragic 87.0% |
| Mongolians | 0.0 /100 | #281 | Tragic 87.0% |
| Colville | 0.0 /100 | #282 | Tragic 86.8% |
| Immigrants | Eastern Europe | 0.0 /100 | #283 | Tragic 86.7% |
| Central American Indians | 0.0 /100 | #284 | Tragic 86.7% |
| Immigrants | Kazakhstan | 0.0 /100 | #285 | Tragic 86.6% |
| Immigrants | Eastern Asia | 0.0 /100 | #286 | Tragic 86.5% |
| Immigrants | Malaysia | 0.0 /100 | #287 | Tragic 86.5% |
| Hopi | 0.0 /100 | #288 | Tragic 86.4% |
| Immigrants | Ireland | 0.0 /100 | #289 | Tragic 86.4% |
| Immigrants | Australia | 0.0 /100 | #290 | Tragic 86.4% |
| Pima | 0.0 /100 | #291 | Tragic 86.3% |
| Okinawans | 0.0 /100 | #292 | Tragic 86.1% |
| Indians (Asian) | 0.0 /100 | #293 | Tragic 86.0% |
Demographics Similar to Senegalese by 1 or more Vehicles in Household
In terms of 1 or more vehicles in household, the demographic groups most similar to Senegalese are Immigrants from Caribbean (80.4%, a difference of 0.10%), Immigrants from Yemen (80.5%, a difference of 0.22%), Immigrants from West Indies (79.5%, a difference of 1.1%), Immigrants from Cabo Verde (81.6%, a difference of 1.5%), and Immigrants from Senegal (79.0%, a difference of 1.7%).
| Demographics | Rating | Rank | 1 or more Vehicles in Household |
| Immigrants | Ghana | 0.0 /100 | #318 | Tragic 83.4% |
| Immigrants | Belarus | 0.0 /100 | #319 | Tragic 83.3% |
| Soviet Union | 0.0 /100 | #320 | Tragic 82.7% |
| Jamaicans | 0.0 /100 | #321 | Tragic 82.1% |
| Immigrants | Cabo Verde | 0.0 /100 | #322 | Tragic 81.6% |
| Immigrants | Yemen | 0.0 /100 | #323 | Tragic 80.5% |
| Immigrants | Caribbean | 0.0 /100 | #324 | Tragic 80.4% |
| Senegalese | 0.0 /100 | #325 | Tragic 80.4% |
| Immigrants | West Indies | 0.0 /100 | #326 | Tragic 79.5% |
| Immigrants | Senegal | 0.0 /100 | #327 | Tragic 79.0% |
| Ecuadorians | 0.0 /100 | #328 | Tragic 77.9% |
| Immigrants | Dominica | 0.0 /100 | #329 | Tragic 77.8% |
| Immigrants | Trinidad and Tobago | 0.0 /100 | #330 | Tragic 76.8% |
| West Indians | 0.0 /100 | #331 | Tragic 76.4% |
| Trinidadians and Tobagonians | 0.0 /100 | #332 | Tragic 76.3% |