Cajun vs Senegalese 1 or more Vehicles in Household
COMPARE
Cajun
Senegalese
1 or more Vehicles in Household
1 or more Vehicles in Household Comparison
Cajuns
Senegalese
91.7%
1 OR MORE VEHICLES IN HOUSEHOLD
99.7/ 100
METRIC RATING
72nd/ 347
METRIC RANK
80.4%
1 OR MORE VEHICLES IN HOUSEHOLD
0.0/ 100
METRIC RATING
325th/ 347
METRIC RANK
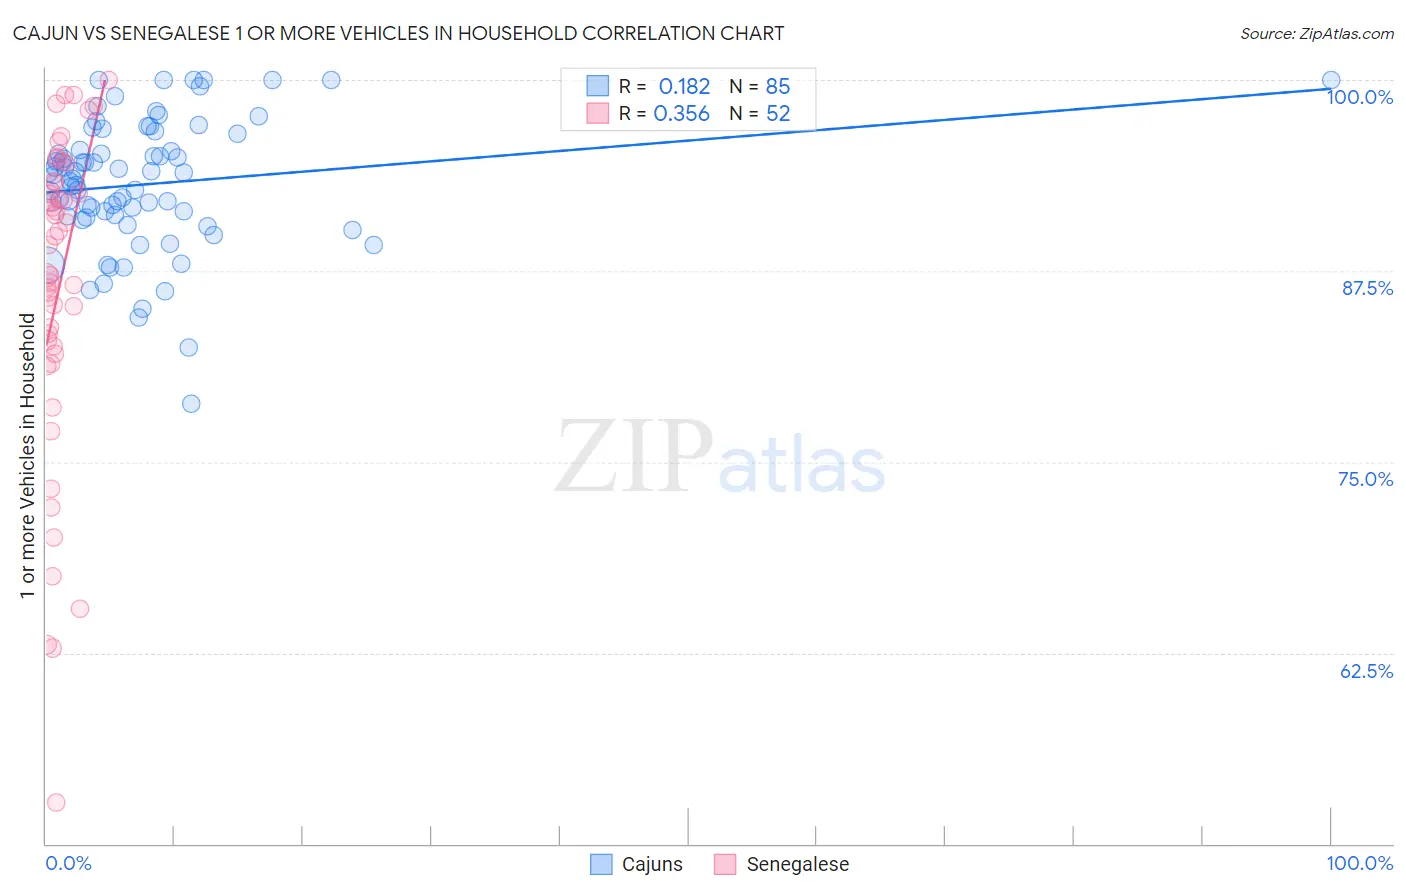
Cajun vs Senegalese 1 or more Vehicles in Household Correlation Chart
The statistical analysis conducted on geographies consisting of 149,696,073 people shows a poor positive correlation between the proportion of Cajuns and percentage of households with 1 or more vehicles available in the United States with a correlation coefficient (R) of 0.182 and weighted average of 91.7%. Similarly, the statistical analysis conducted on geographies consisting of 78,083,411 people shows a mild positive correlation between the proportion of Senegalese and percentage of households with 1 or more vehicles available in the United States with a correlation coefficient (R) of 0.356 and weighted average of 80.4%, a difference of 14.1%.
1 or more Vehicles in Household Correlation Summary
| Measurement | Cajun | Senegalese |
| Minimum | 78.8% | 52.7% |
| Maximum | 100.0% | 100.0% |
| Range | 21.2% | 47.3% |
| Mean | 93.2% | 86.2% |
| Median | 93.6% | 88.2% |
| Interquartile 25% (IQ1) | 91.0% | 82.3% |
| Interquartile 75% (IQ3) | 96.0% | 93.3% |
| Interquartile Range (IQR) | 4.9% | 11.0% |
| Standard Deviation (Sample) | 4.3% | 10.6% |
| Standard Deviation (Population) | 4.2% | 10.5% |
Similar Demographics by 1 or more Vehicles in Household
Demographics Similar to Cajuns by 1 or more Vehicles in Household
In terms of 1 or more vehicles in household, the demographic groups most similar to Cajuns are Polish (91.7%, a difference of 0.0%), Immigrants from Iran (91.7%, a difference of 0.010%), Lithuanian (91.7%, a difference of 0.020%), Palestinian (91.7%, a difference of 0.040%), and Immigrants from Lebanon (91.6%, a difference of 0.050%).
| Demographics | Rating | Rank | 1 or more Vehicles in Household |
| Immigrants | Laos | 99.8 /100 | #65 | Exceptional 91.8% |
| Canadians | 99.8 /100 | #66 | Exceptional 91.8% |
| Spaniards | 99.8 /100 | #67 | Exceptional 91.8% |
| Immigrants | Scotland | 99.7 /100 | #68 | Exceptional 91.8% |
| Palestinians | 99.7 /100 | #69 | Exceptional 91.7% |
| Lithuanians | 99.7 /100 | #70 | Exceptional 91.7% |
| Poles | 99.7 /100 | #71 | Exceptional 91.7% |
| Cajuns | 99.7 /100 | #72 | Exceptional 91.7% |
| Immigrants | Iran | 99.7 /100 | #73 | Exceptional 91.7% |
| Immigrants | Lebanon | 99.6 /100 | #74 | Exceptional 91.6% |
| Portuguese | 99.5 /100 | #75 | Exceptional 91.6% |
| Cubans | 99.5 /100 | #76 | Exceptional 91.5% |
| Immigrants | Philippines | 99.4 /100 | #77 | Exceptional 91.5% |
| Iranians | 99.4 /100 | #78 | Exceptional 91.5% |
| Immigrants | South Central Asia | 99.4 /100 | #79 | Exceptional 91.5% |
Demographics Similar to Senegalese by 1 or more Vehicles in Household
In terms of 1 or more vehicles in household, the demographic groups most similar to Senegalese are Immigrants from Caribbean (80.4%, a difference of 0.10%), Immigrants from Yemen (80.5%, a difference of 0.22%), Immigrants from West Indies (79.5%, a difference of 1.1%), Immigrants from Cabo Verde (81.6%, a difference of 1.5%), and Immigrants from Senegal (79.0%, a difference of 1.7%).
| Demographics | Rating | Rank | 1 or more Vehicles in Household |
| Immigrants | Ghana | 0.0 /100 | #318 | Tragic 83.4% |
| Immigrants | Belarus | 0.0 /100 | #319 | Tragic 83.3% |
| Soviet Union | 0.0 /100 | #320 | Tragic 82.7% |
| Jamaicans | 0.0 /100 | #321 | Tragic 82.1% |
| Immigrants | Cabo Verde | 0.0 /100 | #322 | Tragic 81.6% |
| Immigrants | Yemen | 0.0 /100 | #323 | Tragic 80.5% |
| Immigrants | Caribbean | 0.0 /100 | #324 | Tragic 80.4% |
| Senegalese | 0.0 /100 | #325 | Tragic 80.4% |
| Immigrants | West Indies | 0.0 /100 | #326 | Tragic 79.5% |
| Immigrants | Senegal | 0.0 /100 | #327 | Tragic 79.0% |
| Ecuadorians | 0.0 /100 | #328 | Tragic 77.9% |
| Immigrants | Dominica | 0.0 /100 | #329 | Tragic 77.8% |
| Immigrants | Trinidad and Tobago | 0.0 /100 | #330 | Tragic 76.8% |
| West Indians | 0.0 /100 | #331 | Tragic 76.4% |
| Trinidadians and Tobagonians | 0.0 /100 | #332 | Tragic 76.3% |