German vs African 3 or more Vehicles in Household
COMPARE
German
African
3 or more Vehicles in Household
3 or more Vehicles in Household Comparison
Germans
Africans
22.7%
3 OR MORE VEHICLES IN HOUSEHOLD
100.0/ 100
METRIC RATING
41st/ 347
METRIC RANK
18.2%
3 OR MORE VEHICLES IN HOUSEHOLD
2.7/ 100
METRIC RATING
241st/ 347
METRIC RANK
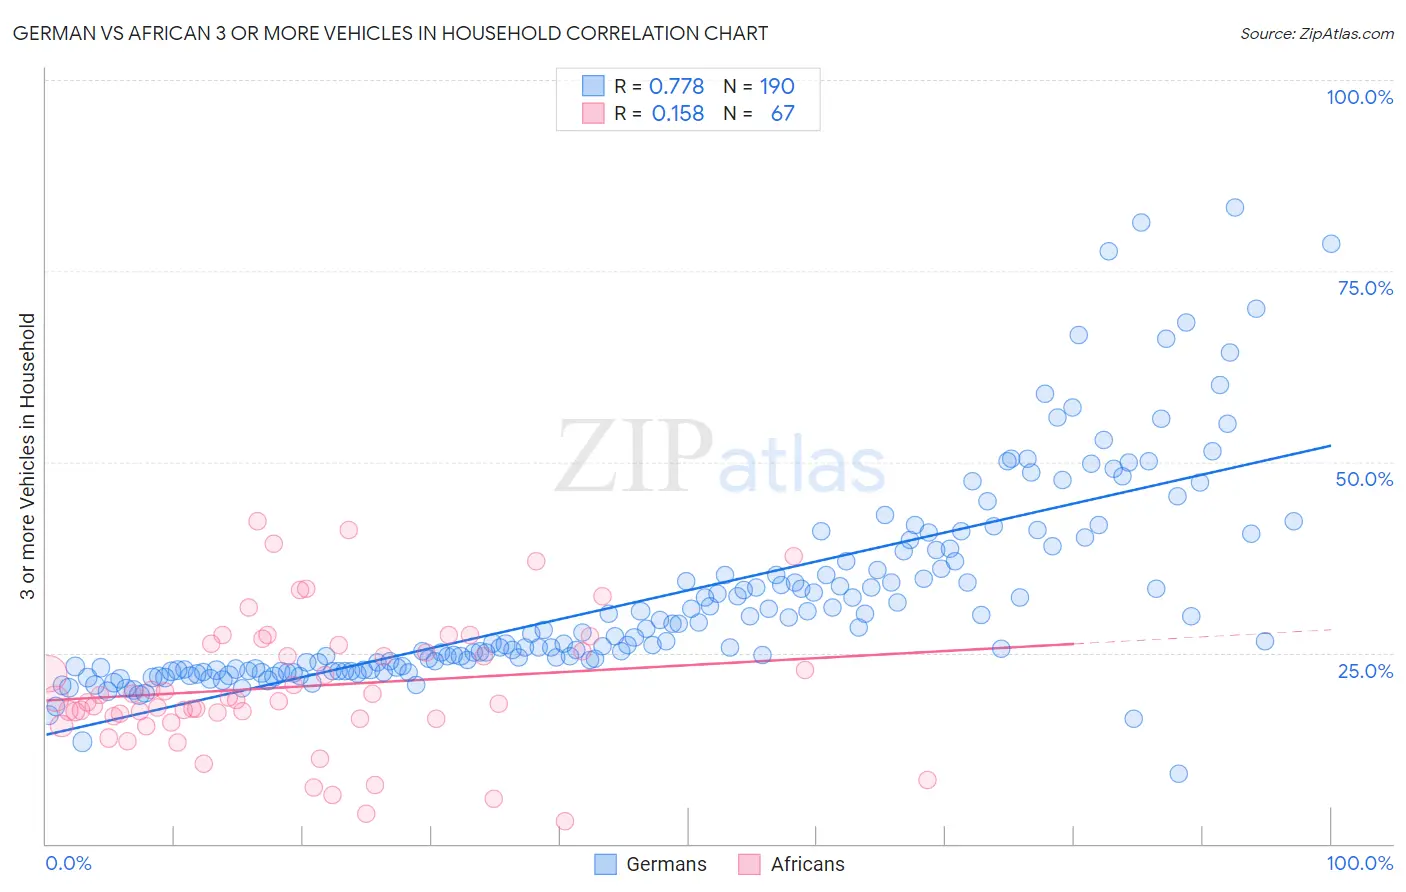
German vs African 3 or more Vehicles in Household Correlation Chart
The statistical analysis conducted on geographies consisting of 580,173,272 people shows a strong positive correlation between the proportion of Germans and percentage of households with 3 or more vehicles available in the United States with a correlation coefficient (R) of 0.778 and weighted average of 22.7%. Similarly, the statistical analysis conducted on geographies consisting of 469,466,855 people shows a poor positive correlation between the proportion of Africans and percentage of households with 3 or more vehicles available in the United States with a correlation coefficient (R) of 0.158 and weighted average of 18.2%, a difference of 25.1%.
3 or more Vehicles in Household Correlation Summary
| Measurement | German | African |
| Minimum | 9.2% | 3.0% |
| Maximum | 83.3% | 42.3% |
| Range | 74.1% | 39.3% |
| Mean | 32.3% | 20.6% |
| Median | 27.1% | 18.9% |
| Interquartile 25% (IQ1) | 22.8% | 16.3% |
| Interquartile 75% (IQ3) | 37.0% | 26.1% |
| Interquartile Range (IQR) | 14.2% | 9.8% |
| Standard Deviation (Sample) | 13.4% | 8.6% |
| Standard Deviation (Population) | 13.4% | 8.6% |
Similar Demographics by 3 or more Vehicles in Household
Demographics Similar to Germans by 3 or more Vehicles in Household
In terms of 3 or more vehicles in household, the demographic groups most similar to Germans are Native/Alaskan (22.7%, a difference of 0.0%), Osage (22.7%, a difference of 0.12%), Cheyenne (22.7%, a difference of 0.25%), Ute (22.7%, a difference of 0.35%), and European (22.9%, a difference of 0.47%).
| Demographics | Rating | Rank | 3 or more Vehicles in Household |
| Swiss | 100.0 /100 | #34 | Exceptional 23.0% |
| Choctaw | 100.0 /100 | #35 | Exceptional 23.0% |
| Cherokee | 100.0 /100 | #36 | Exceptional 23.0% |
| Swedes | 100.0 /100 | #37 | Exceptional 23.0% |
| Dutch | 100.0 /100 | #38 | Exceptional 22.9% |
| Yaqui | 100.0 /100 | #39 | Exceptional 22.9% |
| Europeans | 100.0 /100 | #40 | Exceptional 22.9% |
| Germans | 100.0 /100 | #41 | Exceptional 22.7% |
| Natives/Alaskans | 100.0 /100 | #42 | Exceptional 22.7% |
| Osage | 100.0 /100 | #43 | Exceptional 22.7% |
| Cheyenne | 100.0 /100 | #44 | Exceptional 22.7% |
| Ute | 100.0 /100 | #45 | Exceptional 22.7% |
| Americans | 100.0 /100 | #46 | Exceptional 22.6% |
| Malaysians | 100.0 /100 | #47 | Exceptional 22.6% |
| Scottish | 100.0 /100 | #48 | Exceptional 22.6% |
Demographics Similar to Africans by 3 or more Vehicles in Household
In terms of 3 or more vehicles in household, the demographic groups most similar to Africans are Hopi (18.2%, a difference of 0.11%), Immigrants from China (18.2%, a difference of 0.20%), Immigrants from Europe (18.1%, a difference of 0.23%), Immigrants from Middle Africa (18.2%, a difference of 0.32%), and Immigrants from Honduras (18.2%, a difference of 0.33%).
| Demographics | Rating | Rank | 3 or more Vehicles in Household |
| Immigrants | North Macedonia | 4.4 /100 | #234 | Tragic 18.4% |
| Sierra Leoneans | 3.9 /100 | #235 | Tragic 18.3% |
| Immigrants | Malaysia | 3.6 /100 | #236 | Tragic 18.3% |
| Indonesians | 3.5 /100 | #237 | Tragic 18.3% |
| Immigrants | Honduras | 3.1 /100 | #238 | Tragic 18.2% |
| Immigrants | Middle Africa | 3.1 /100 | #239 | Tragic 18.2% |
| Immigrants | China | 2.9 /100 | #240 | Tragic 18.2% |
| Africans | 2.7 /100 | #241 | Tragic 18.2% |
| Hopi | 2.5 /100 | #242 | Tragic 18.2% |
| Immigrants | Europe | 2.4 /100 | #243 | Tragic 18.1% |
| Mongolians | 2.3 /100 | #244 | Tragic 18.1% |
| Immigrants | Belize | 2.1 /100 | #245 | Tragic 18.1% |
| Immigrants | Australia | 2.0 /100 | #246 | Tragic 18.1% |
| Carpatho Rusyns | 1.9 /100 | #247 | Tragic 18.0% |
| Immigrants | Eastern Africa | 1.8 /100 | #248 | Tragic 18.0% |