Immigrants from Kuwait vs African 3 or more Vehicles in Household
COMPARE
Immigrants from Kuwait
African
3 or more Vehicles in Household
3 or more Vehicles in Household Comparison
Immigrants from Kuwait
Africans
19.1%
3 OR MORE VEHICLES IN HOUSEHOLD
26.1/ 100
METRIC RATING
188th/ 347
METRIC RANK
18.2%
3 OR MORE VEHICLES IN HOUSEHOLD
2.7/ 100
METRIC RATING
241st/ 347
METRIC RANK
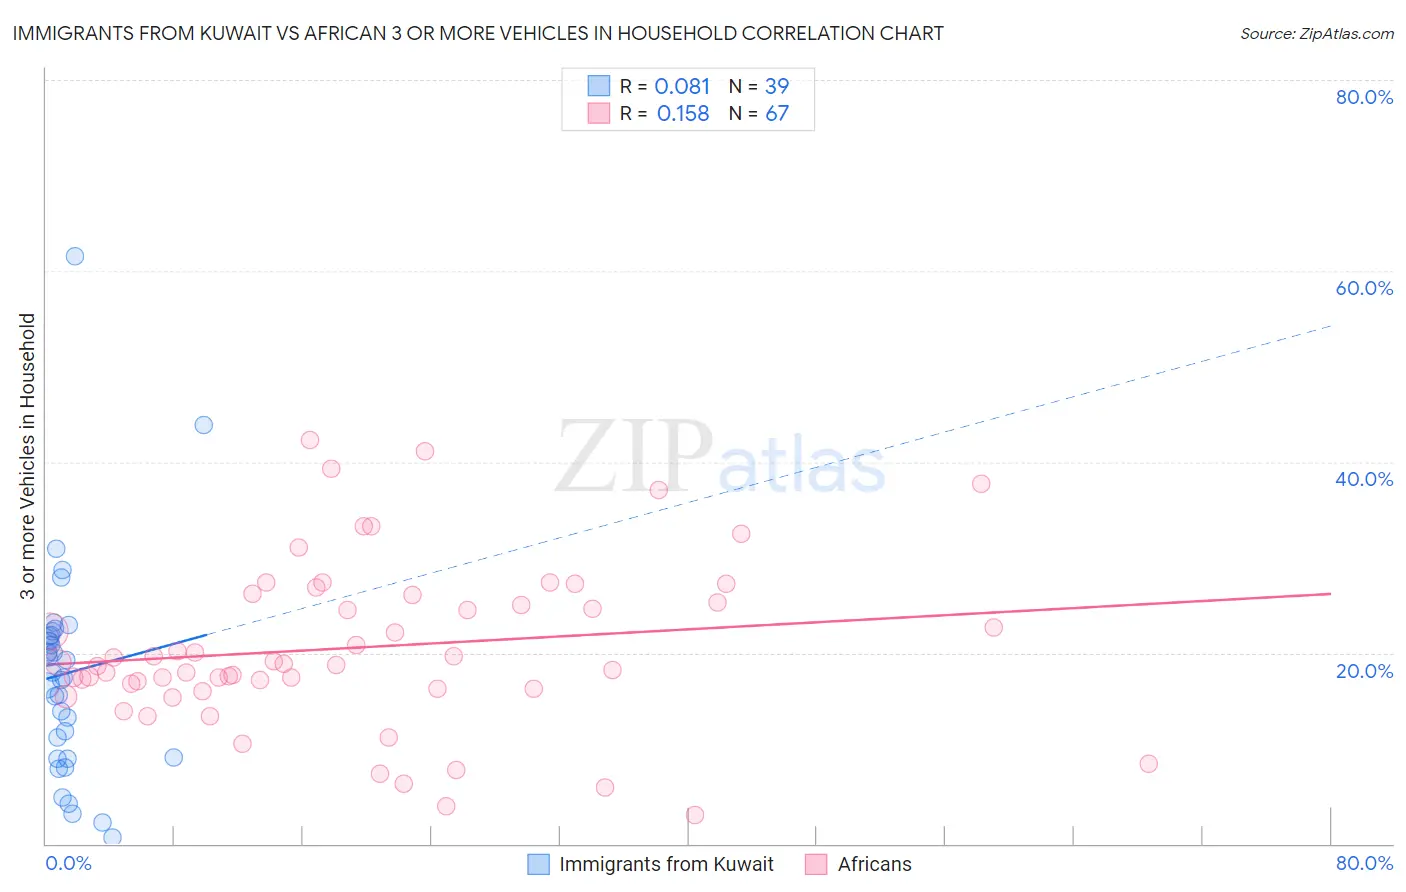
Immigrants from Kuwait vs African 3 or more Vehicles in Household Correlation Chart
The statistical analysis conducted on geographies consisting of 136,861,731 people shows a slight positive correlation between the proportion of Immigrants from Kuwait and percentage of households with 3 or more vehicles available in the United States with a correlation coefficient (R) of 0.081 and weighted average of 19.1%. Similarly, the statistical analysis conducted on geographies consisting of 469,466,855 people shows a poor positive correlation between the proportion of Africans and percentage of households with 3 or more vehicles available in the United States with a correlation coefficient (R) of 0.158 and weighted average of 18.2%, a difference of 5.2%.
3 or more Vehicles in Household Correlation Summary
| Measurement | Immigrants from Kuwait | African |
| Minimum | 0.71% | 3.0% |
| Maximum | 61.6% | 42.3% |
| Range | 60.9% | 39.3% |
| Mean | 17.9% | 20.6% |
| Median | 17.9% | 18.9% |
| Interquartile 25% (IQ1) | 9.1% | 16.3% |
| Interquartile 75% (IQ3) | 21.8% | 26.1% |
| Interquartile Range (IQR) | 12.7% | 9.8% |
| Standard Deviation (Sample) | 11.3% | 8.6% |
| Standard Deviation (Population) | 11.1% | 8.6% |
Similar Demographics by 3 or more Vehicles in Household
Demographics Similar to Immigrants from Kuwait by 3 or more Vehicles in Household
In terms of 3 or more vehicles in household, the demographic groups most similar to Immigrants from Kuwait are Indian (Asian) (19.1%, a difference of 0.010%), Immigrants from Zimbabwe (19.1%, a difference of 0.060%), South American Indian (19.1%, a difference of 0.070%), Kenyan (19.1%, a difference of 0.14%), and Tsimshian (19.1%, a difference of 0.17%).
| Demographics | Rating | Rank | 3 or more Vehicles in Household |
| Romanians | 37.1 /100 | #181 | Fair 19.3% |
| Cubans | 36.6 /100 | #182 | Fair 19.3% |
| Cajuns | 36.0 /100 | #183 | Fair 19.3% |
| Latvians | 35.7 /100 | #184 | Fair 19.3% |
| Immigrants | Sri Lanka | 30.7 /100 | #185 | Fair 19.2% |
| Immigrants | Sweden | 29.0 /100 | #186 | Fair 19.2% |
| Immigrants | Hong Kong | 28.3 /100 | #187 | Fair 19.2% |
| Immigrants | Kuwait | 26.1 /100 | #188 | Fair 19.1% |
| Indians (Asian) | 26.0 /100 | #189 | Fair 19.1% |
| Immigrants | Zimbabwe | 25.5 /100 | #190 | Fair 19.1% |
| South American Indians | 25.4 /100 | #191 | Fair 19.1% |
| Kenyans | 24.7 /100 | #192 | Fair 19.1% |
| Tsimshian | 24.4 /100 | #193 | Fair 19.1% |
| Serbians | 24.0 /100 | #194 | Fair 19.1% |
| Immigrants | Moldova | 23.6 /100 | #195 | Fair 19.1% |
Demographics Similar to Africans by 3 or more Vehicles in Household
In terms of 3 or more vehicles in household, the demographic groups most similar to Africans are Hopi (18.2%, a difference of 0.11%), Immigrants from China (18.2%, a difference of 0.20%), Immigrants from Europe (18.1%, a difference of 0.23%), Immigrants from Middle Africa (18.2%, a difference of 0.32%), and Immigrants from Honduras (18.2%, a difference of 0.33%).
| Demographics | Rating | Rank | 3 or more Vehicles in Household |
| Immigrants | North Macedonia | 4.4 /100 | #234 | Tragic 18.4% |
| Sierra Leoneans | 3.9 /100 | #235 | Tragic 18.3% |
| Immigrants | Malaysia | 3.6 /100 | #236 | Tragic 18.3% |
| Indonesians | 3.5 /100 | #237 | Tragic 18.3% |
| Immigrants | Honduras | 3.1 /100 | #238 | Tragic 18.2% |
| Immigrants | Middle Africa | 3.1 /100 | #239 | Tragic 18.2% |
| Immigrants | China | 2.9 /100 | #240 | Tragic 18.2% |
| Africans | 2.7 /100 | #241 | Tragic 18.2% |
| Hopi | 2.5 /100 | #242 | Tragic 18.2% |
| Immigrants | Europe | 2.4 /100 | #243 | Tragic 18.1% |
| Mongolians | 2.3 /100 | #244 | Tragic 18.1% |
| Immigrants | Belize | 2.1 /100 | #245 | Tragic 18.1% |
| Immigrants | Australia | 2.0 /100 | #246 | Tragic 18.1% |
| Carpatho Rusyns | 1.9 /100 | #247 | Tragic 18.0% |
| Immigrants | Eastern Africa | 1.8 /100 | #248 | Tragic 18.0% |