Immigrants from Colombia vs African 3 or more Vehicles in Household
COMPARE
Immigrants from Colombia
African
3 or more Vehicles in Household
3 or more Vehicles in Household Comparison
Immigrants from Colombia
Africans
17.3%
3 OR MORE VEHICLES IN HOUSEHOLD
0.3/ 100
METRIC RATING
284th/ 347
METRIC RANK
18.2%
3 OR MORE VEHICLES IN HOUSEHOLD
2.7/ 100
METRIC RATING
241st/ 347
METRIC RANK
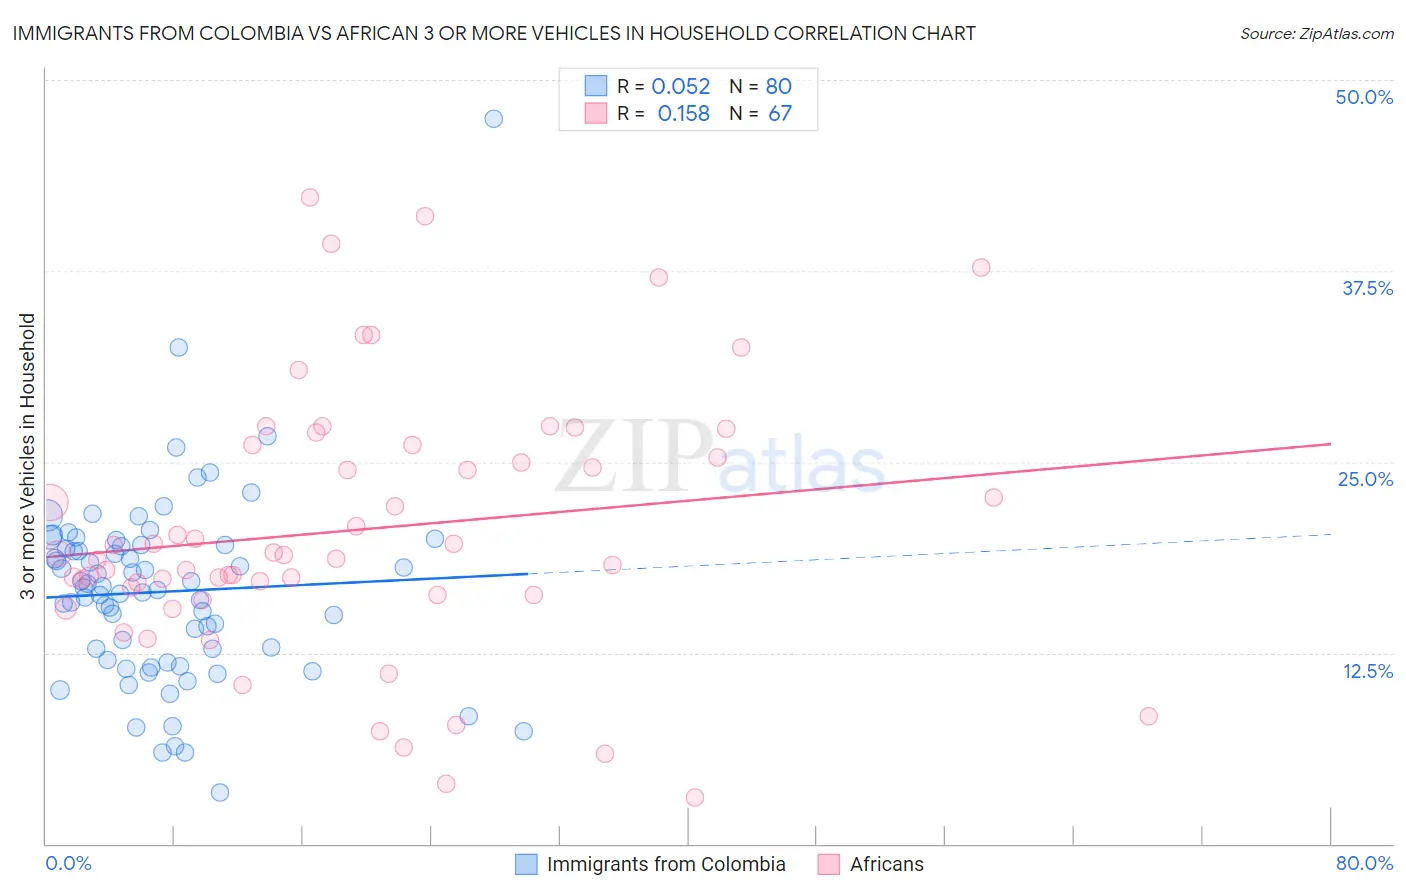
Immigrants from Colombia vs African 3 or more Vehicles in Household Correlation Chart
The statistical analysis conducted on geographies consisting of 378,439,541 people shows a slight positive correlation between the proportion of Immigrants from Colombia and percentage of households with 3 or more vehicles available in the United States with a correlation coefficient (R) of 0.052 and weighted average of 17.3%. Similarly, the statistical analysis conducted on geographies consisting of 469,466,855 people shows a poor positive correlation between the proportion of Africans and percentage of households with 3 or more vehicles available in the United States with a correlation coefficient (R) of 0.158 and weighted average of 18.2%, a difference of 5.0%.
3 or more Vehicles in Household Correlation Summary
| Measurement | Immigrants from Colombia | African |
| Minimum | 3.3% | 3.0% |
| Maximum | 47.5% | 42.3% |
| Range | 44.2% | 39.3% |
| Mean | 16.5% | 20.6% |
| Median | 16.7% | 18.9% |
| Interquartile 25% (IQ1) | 12.4% | 16.3% |
| Interquartile 75% (IQ3) | 19.5% | 26.1% |
| Interquartile Range (IQR) | 7.1% | 9.8% |
| Standard Deviation (Sample) | 6.3% | 8.6% |
| Standard Deviation (Population) | 6.2% | 8.6% |
Similar Demographics by 3 or more Vehicles in Household
Demographics Similar to Immigrants from Colombia by 3 or more Vehicles in Household
In terms of 3 or more vehicles in household, the demographic groups most similar to Immigrants from Colombia are Black/African American (17.3%, a difference of 0.12%), Immigrants from Ireland (17.3%, a difference of 0.17%), Immigrants from Latvia (17.4%, a difference of 0.46%), Immigrants from Eastern Europe (17.4%, a difference of 0.50%), and Immigrants from Kazakhstan (17.4%, a difference of 0.54%).
| Demographics | Rating | Rank | 3 or more Vehicles in Household |
| Brazilians | 0.4 /100 | #277 | Tragic 17.4% |
| Immigrants | Bahamas | 0.3 /100 | #278 | Tragic 17.4% |
| Immigrants | Kazakhstan | 0.3 /100 | #279 | Tragic 17.4% |
| Immigrants | Eastern Europe | 0.3 /100 | #280 | Tragic 17.4% |
| Immigrants | Latvia | 0.3 /100 | #281 | Tragic 17.4% |
| Immigrants | Ireland | 0.3 /100 | #282 | Tragic 17.3% |
| Blacks/African Americans | 0.3 /100 | #283 | Tragic 17.3% |
| Immigrants | Colombia | 0.3 /100 | #284 | Tragic 17.3% |
| Immigrants | Croatia | 0.2 /100 | #285 | Tragic 17.2% |
| Menominee | 0.2 /100 | #286 | Tragic 17.2% |
| Immigrants | Brazil | 0.2 /100 | #287 | Tragic 17.1% |
| Immigrants | Uruguay | 0.2 /100 | #288 | Tragic 17.1% |
| Immigrants | Liberia | 0.1 /100 | #289 | Tragic 17.1% |
| Liberians | 0.1 /100 | #290 | Tragic 17.0% |
| Immigrants | Congo | 0.1 /100 | #291 | Tragic 17.0% |
Demographics Similar to Africans by 3 or more Vehicles in Household
In terms of 3 or more vehicles in household, the demographic groups most similar to Africans are Hopi (18.2%, a difference of 0.11%), Immigrants from China (18.2%, a difference of 0.20%), Immigrants from Europe (18.1%, a difference of 0.23%), Immigrants from Middle Africa (18.2%, a difference of 0.32%), and Immigrants from Honduras (18.2%, a difference of 0.33%).
| Demographics | Rating | Rank | 3 or more Vehicles in Household |
| Immigrants | North Macedonia | 4.4 /100 | #234 | Tragic 18.4% |
| Sierra Leoneans | 3.9 /100 | #235 | Tragic 18.3% |
| Immigrants | Malaysia | 3.6 /100 | #236 | Tragic 18.3% |
| Indonesians | 3.5 /100 | #237 | Tragic 18.3% |
| Immigrants | Honduras | 3.1 /100 | #238 | Tragic 18.2% |
| Immigrants | Middle Africa | 3.1 /100 | #239 | Tragic 18.2% |
| Immigrants | China | 2.9 /100 | #240 | Tragic 18.2% |
| Africans | 2.7 /100 | #241 | Tragic 18.2% |
| Hopi | 2.5 /100 | #242 | Tragic 18.2% |
| Immigrants | Europe | 2.4 /100 | #243 | Tragic 18.1% |
| Mongolians | 2.3 /100 | #244 | Tragic 18.1% |
| Immigrants | Belize | 2.1 /100 | #245 | Tragic 18.1% |
| Immigrants | Australia | 2.0 /100 | #246 | Tragic 18.1% |
| Carpatho Rusyns | 1.9 /100 | #247 | Tragic 18.0% |
| Immigrants | Eastern Africa | 1.8 /100 | #248 | Tragic 18.0% |