Immigrants from Central America vs Okinawan 3 or more Vehicles in Household
COMPARE
Immigrants from Central America
Okinawan
3 or more Vehicles in Household
3 or more Vehicles in Household Comparison
Immigrants from Central America
Okinawans
23.4%
3 OR MORE VEHICLES IN HOUSEHOLD
100.0/ 100
METRIC RATING
25th/ 347
METRIC RANK
17.4%
3 OR MORE VEHICLES IN HOUSEHOLD
0.4/ 100
METRIC RATING
276th/ 347
METRIC RANK
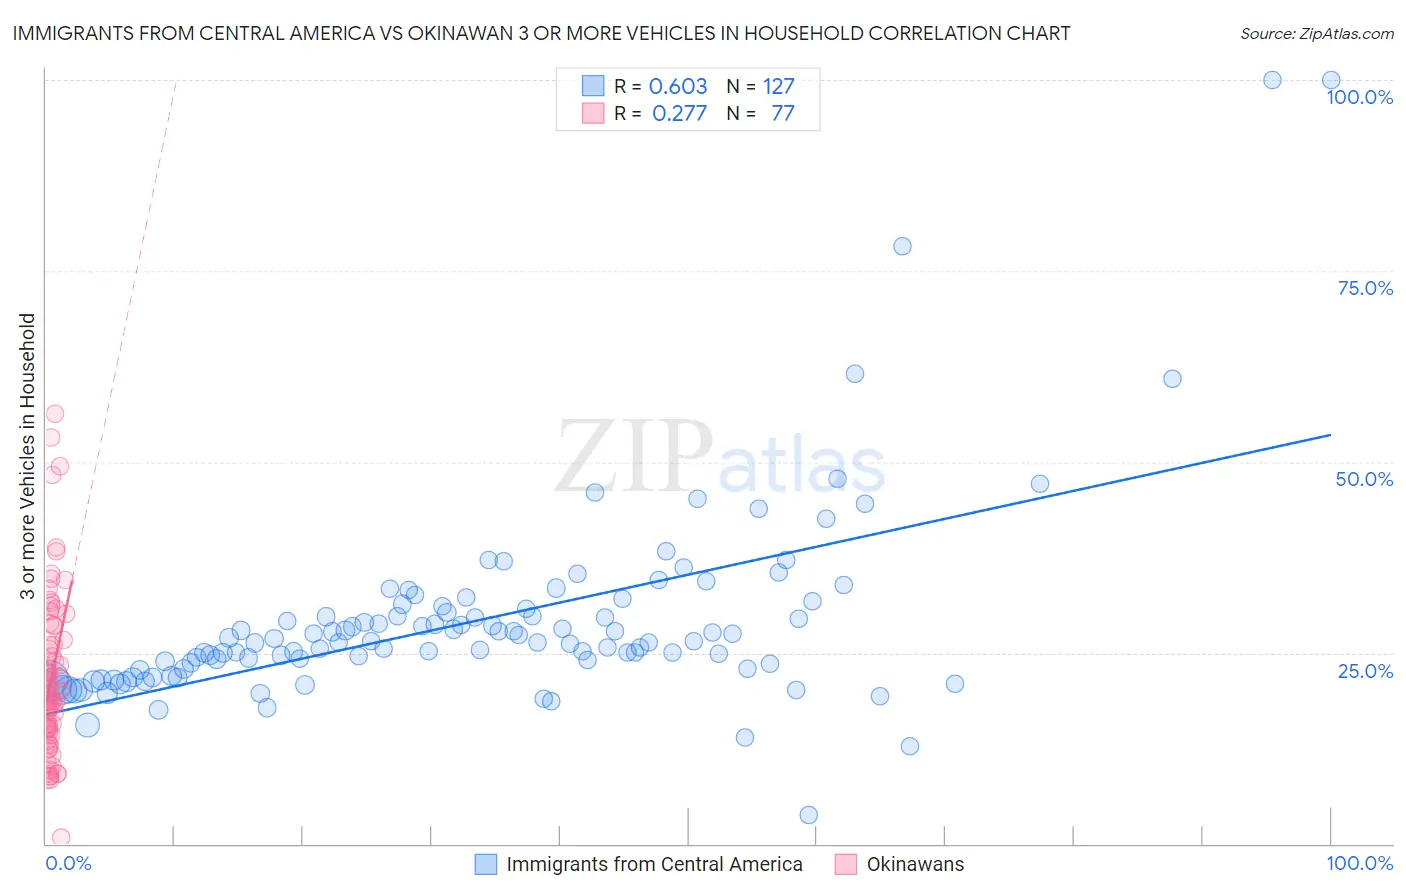
Immigrants from Central America vs Okinawan 3 or more Vehicles in Household Correlation Chart
The statistical analysis conducted on geographies consisting of 535,876,372 people shows a significant positive correlation between the proportion of Immigrants from Central America and percentage of households with 3 or more vehicles available in the United States with a correlation coefficient (R) of 0.603 and weighted average of 23.4%. Similarly, the statistical analysis conducted on geographies consisting of 73,703,163 people shows a weak positive correlation between the proportion of Okinawans and percentage of households with 3 or more vehicles available in the United States with a correlation coefficient (R) of 0.277 and weighted average of 17.4%, a difference of 34.3%.
3 or more Vehicles in Household Correlation Summary
| Measurement | Immigrants from Central America | Okinawan |
| Minimum | 3.8% | 0.75% |
| Maximum | 100.0% | 56.2% |
| Range | 96.2% | 55.5% |
| Mean | 29.1% | 21.7% |
| Median | 26.4% | 19.5% |
| Interquartile 25% (IQ1) | 22.9% | 14.8% |
| Interquartile 75% (IQ3) | 30.8% | 27.6% |
| Interquartile Range (IQR) | 7.9% | 12.8% |
| Standard Deviation (Sample) | 12.9% | 10.7% |
| Standard Deviation (Population) | 12.9% | 10.6% |
Similar Demographics by 3 or more Vehicles in Household
Demographics Similar to Immigrants from Central America by 3 or more Vehicles in Household
In terms of 3 or more vehicles in household, the demographic groups most similar to Immigrants from Central America are Sri Lankan (23.6%, a difference of 0.51%), Scandinavian (23.6%, a difference of 0.77%), Mexican American Indian (23.3%, a difference of 0.77%), Guamanian/Chamorro (23.2%, a difference of 0.91%), and Lumbee (23.1%, a difference of 1.2%).
| Demographics | Rating | Rank | 3 or more Vehicles in Household |
| Norwegians | 100.0 /100 | #18 | Exceptional 23.9% |
| Chinese | 100.0 /100 | #19 | Exceptional 23.9% |
| Paiute | 100.0 /100 | #20 | Exceptional 23.8% |
| Immigrants | Vietnam | 100.0 /100 | #21 | Exceptional 23.8% |
| Immigrants | Philippines | 100.0 /100 | #22 | Exceptional 23.8% |
| Scandinavians | 100.0 /100 | #23 | Exceptional 23.6% |
| Sri Lankans | 100.0 /100 | #24 | Exceptional 23.6% |
| Immigrants | Central America | 100.0 /100 | #25 | Exceptional 23.4% |
| Mexican American Indians | 100.0 /100 | #26 | Exceptional 23.3% |
| Guamanians/Chamorros | 100.0 /100 | #27 | Exceptional 23.2% |
| Lumbee | 100.0 /100 | #28 | Exceptional 23.1% |
| Spanish | 100.0 /100 | #29 | Exceptional 23.1% |
| Immigrants | South Eastern Asia | 100.0 /100 | #30 | Exceptional 23.1% |
| English | 100.0 /100 | #31 | Exceptional 23.1% |
| Pueblo | 100.0 /100 | #32 | Exceptional 23.0% |
Demographics Similar to Okinawans by 3 or more Vehicles in Household
In terms of 3 or more vehicles in household, the demographic groups most similar to Okinawans are Brazilian (17.4%, a difference of 0.14%), Immigrants from Ukraine (17.5%, a difference of 0.16%), Immigrants from Bahamas (17.4%, a difference of 0.23%), Immigrants from Kazakhstan (17.4%, a difference of 0.25%), and Immigrants from Eastern Europe (17.4%, a difference of 0.29%).
| Demographics | Rating | Rank | 3 or more Vehicles in Household |
| Immigrants | France | 0.6 /100 | #269 | Tragic 17.6% |
| Immigrants | Nepal | 0.6 /100 | #270 | Tragic 17.6% |
| South Americans | 0.6 /100 | #271 | Tragic 17.6% |
| Immigrants | Africa | 0.5 /100 | #272 | Tragic 17.6% |
| Immigrants | Sudan | 0.5 /100 | #273 | Tragic 17.6% |
| Immigrants | Bosnia and Herzegovina | 0.5 /100 | #274 | Tragic 17.5% |
| Immigrants | Ukraine | 0.4 /100 | #275 | Tragic 17.5% |
| Okinawans | 0.4 /100 | #276 | Tragic 17.4% |
| Brazilians | 0.4 /100 | #277 | Tragic 17.4% |
| Immigrants | Bahamas | 0.3 /100 | #278 | Tragic 17.4% |
| Immigrants | Kazakhstan | 0.3 /100 | #279 | Tragic 17.4% |
| Immigrants | Eastern Europe | 0.3 /100 | #280 | Tragic 17.4% |
| Immigrants | Latvia | 0.3 /100 | #281 | Tragic 17.4% |
| Immigrants | Ireland | 0.3 /100 | #282 | Tragic 17.3% |
| Blacks/African Americans | 0.3 /100 | #283 | Tragic 17.3% |