Immigrants from Bulgaria vs Immigrants from Poland 3 or more Vehicles in Household
COMPARE
Immigrants from Bulgaria
Immigrants from Poland
3 or more Vehicles in Household
3 or more Vehicles in Household Comparison
Immigrants from Bulgaria
Immigrants from Poland
17.7%
3 OR MORE VEHICLES IN HOUSEHOLD
0.8/ 100
METRIC RATING
268th/ 347
METRIC RANK
18.6%
3 OR MORE VEHICLES IN HOUSEHOLD
7.5/ 100
METRIC RATING
221st/ 347
METRIC RANK
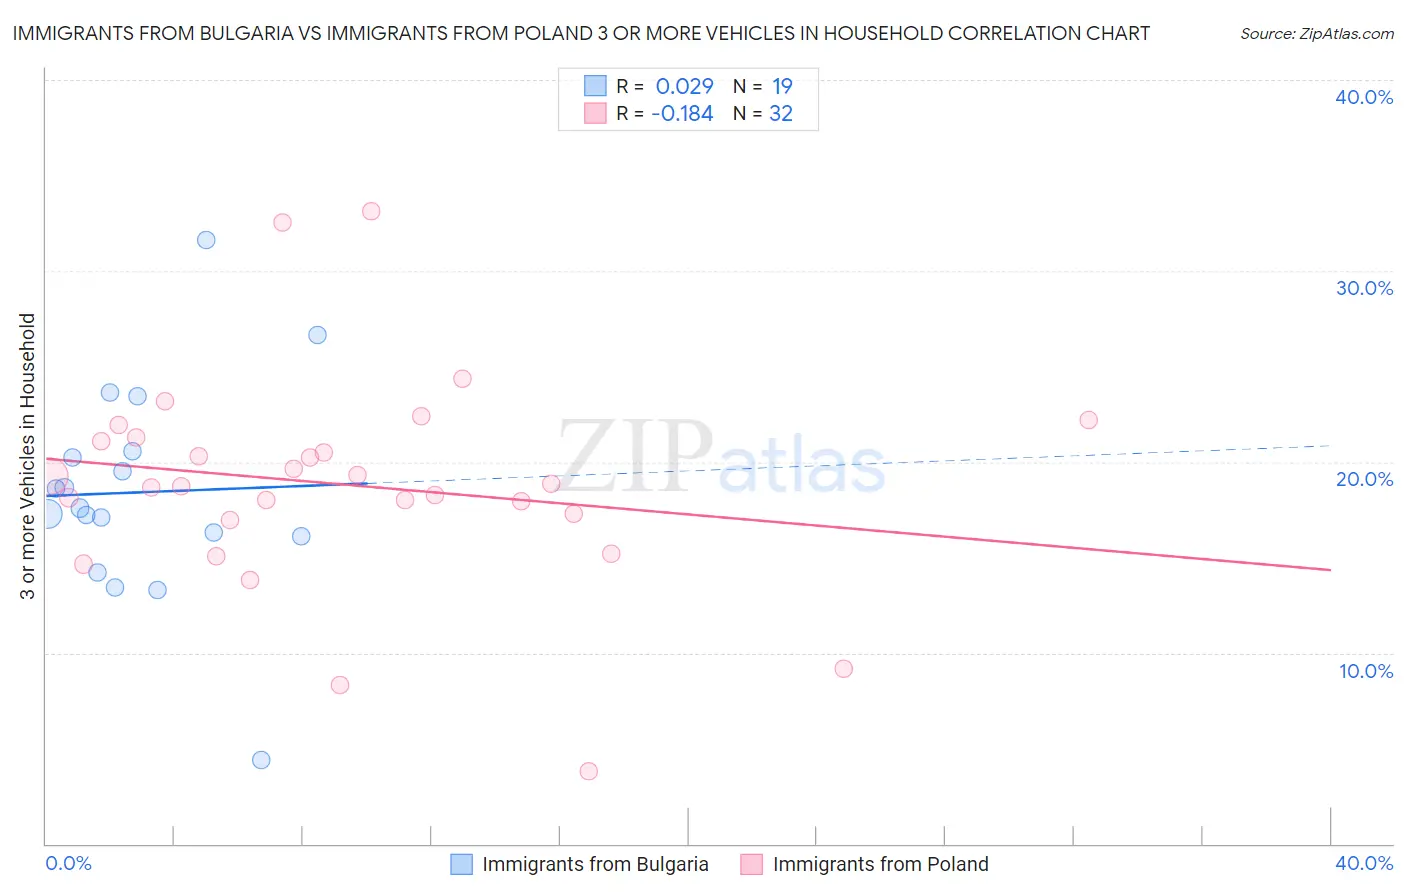
Immigrants from Bulgaria vs Immigrants from Poland 3 or more Vehicles in Household Correlation Chart
The statistical analysis conducted on geographies consisting of 172,519,366 people shows no correlation between the proportion of Immigrants from Bulgaria and percentage of households with 3 or more vehicles available in the United States with a correlation coefficient (R) of 0.029 and weighted average of 17.7%. Similarly, the statistical analysis conducted on geographies consisting of 304,731,133 people shows a poor negative correlation between the proportion of Immigrants from Poland and percentage of households with 3 or more vehicles available in the United States with a correlation coefficient (R) of -0.184 and weighted average of 18.6%, a difference of 4.9%.
3 or more Vehicles in Household Correlation Summary
| Measurement | Immigrants from Bulgaria | Immigrants from Poland |
| Minimum | 4.4% | 3.8% |
| Maximum | 31.6% | 33.1% |
| Range | 27.3% | 29.3% |
| Mean | 18.4% | 18.8% |
| Median | 17.6% | 18.8% |
| Interquartile 25% (IQ1) | 16.1% | 17.1% |
| Interquartile 75% (IQ3) | 20.5% | 21.2% |
| Interquartile Range (IQR) | 4.4% | 4.0% |
| Standard Deviation (Sample) | 5.7% | 5.7% |
| Standard Deviation (Population) | 5.5% | 5.6% |
Similar Demographics by 3 or more Vehicles in Household
Demographics Similar to Immigrants from Bulgaria by 3 or more Vehicles in Household
In terms of 3 or more vehicles in household, the demographic groups most similar to Immigrants from Bulgaria are Immigrants from Venezuela (17.7%, a difference of 0.010%), Macedonian (17.7%, a difference of 0.070%), Immigrants from Panama (17.7%, a difference of 0.090%), Cambodian (17.8%, a difference of 0.23%), and Bermudan (17.8%, a difference of 0.26%).
| Demographics | Rating | Rank | 3 or more Vehicles in Household |
| Immigrants | Northern Africa | 0.9 /100 | #261 | Tragic 17.8% |
| Colombians | 0.9 /100 | #262 | Tragic 17.8% |
| Bermudans | 0.9 /100 | #263 | Tragic 17.8% |
| Cambodians | 0.9 /100 | #264 | Tragic 17.8% |
| Immigrants | Panama | 0.8 /100 | #265 | Tragic 17.7% |
| Macedonians | 0.8 /100 | #266 | Tragic 17.7% |
| Immigrants | Venezuela | 0.8 /100 | #267 | Tragic 17.7% |
| Immigrants | Bulgaria | 0.8 /100 | #268 | Tragic 17.7% |
| Immigrants | France | 0.6 /100 | #269 | Tragic 17.6% |
| Immigrants | Nepal | 0.6 /100 | #270 | Tragic 17.6% |
| South Americans | 0.6 /100 | #271 | Tragic 17.6% |
| Immigrants | Africa | 0.5 /100 | #272 | Tragic 17.6% |
| Immigrants | Sudan | 0.5 /100 | #273 | Tragic 17.6% |
| Immigrants | Bosnia and Herzegovina | 0.5 /100 | #274 | Tragic 17.5% |
| Immigrants | Ukraine | 0.4 /100 | #275 | Tragic 17.5% |
Demographics Similar to Immigrants from Poland by 3 or more Vehicles in Household
In terms of 3 or more vehicles in household, the demographic groups most similar to Immigrants from Poland are Belizean (18.6%, a difference of 0.050%), Nigerian (18.6%, a difference of 0.090%), Immigrants from Armenia (18.6%, a difference of 0.29%), Immigrants from Portugal (18.6%, a difference of 0.37%), and Immigrants from Czechoslovakia (18.5%, a difference of 0.52%).
| Demographics | Rating | Rank | 3 or more Vehicles in Household |
| Immigrants | Sierra Leone | 10.8 /100 | #214 | Poor 18.7% |
| Eastern Europeans | 10.6 /100 | #215 | Poor 18.7% |
| Immigrants | Nigeria | 10.3 /100 | #216 | Poor 18.7% |
| Immigrants | Italy | 10.2 /100 | #217 | Poor 18.7% |
| Immigrants | Portugal | 8.9 /100 | #218 | Tragic 18.6% |
| Immigrants | Armenia | 8.6 /100 | #219 | Tragic 18.6% |
| Nigerians | 7.9 /100 | #220 | Tragic 18.6% |
| Immigrants | Poland | 7.5 /100 | #221 | Tragic 18.6% |
| Belizeans | 7.3 /100 | #222 | Tragic 18.6% |
| Immigrants | Czechoslovakia | 5.9 /100 | #223 | Tragic 18.5% |
| Immigrants | Argentina | 5.6 /100 | #224 | Tragic 18.5% |
| Immigrants | Lithuania | 5.6 /100 | #225 | Tragic 18.5% |
| Immigrants | Hungary | 5.5 /100 | #226 | Tragic 18.5% |
| Immigrants | Singapore | 5.4 /100 | #227 | Tragic 18.4% |
| Turks | 5.4 /100 | #228 | Tragic 18.4% |