Immigrants from Bulgaria vs Austrian 3 or more Vehicles in Household
COMPARE
Immigrants from Bulgaria
Austrian
3 or more Vehicles in Household
3 or more Vehicles in Household Comparison
Immigrants from Bulgaria
Austrians
17.7%
3 OR MORE VEHICLES IN HOUSEHOLD
0.8/ 100
METRIC RATING
268th/ 347
METRIC RANK
20.9%
3 OR MORE VEHICLES IN HOUSEHOLD
97.5/ 100
METRIC RATING
105th/ 347
METRIC RANK
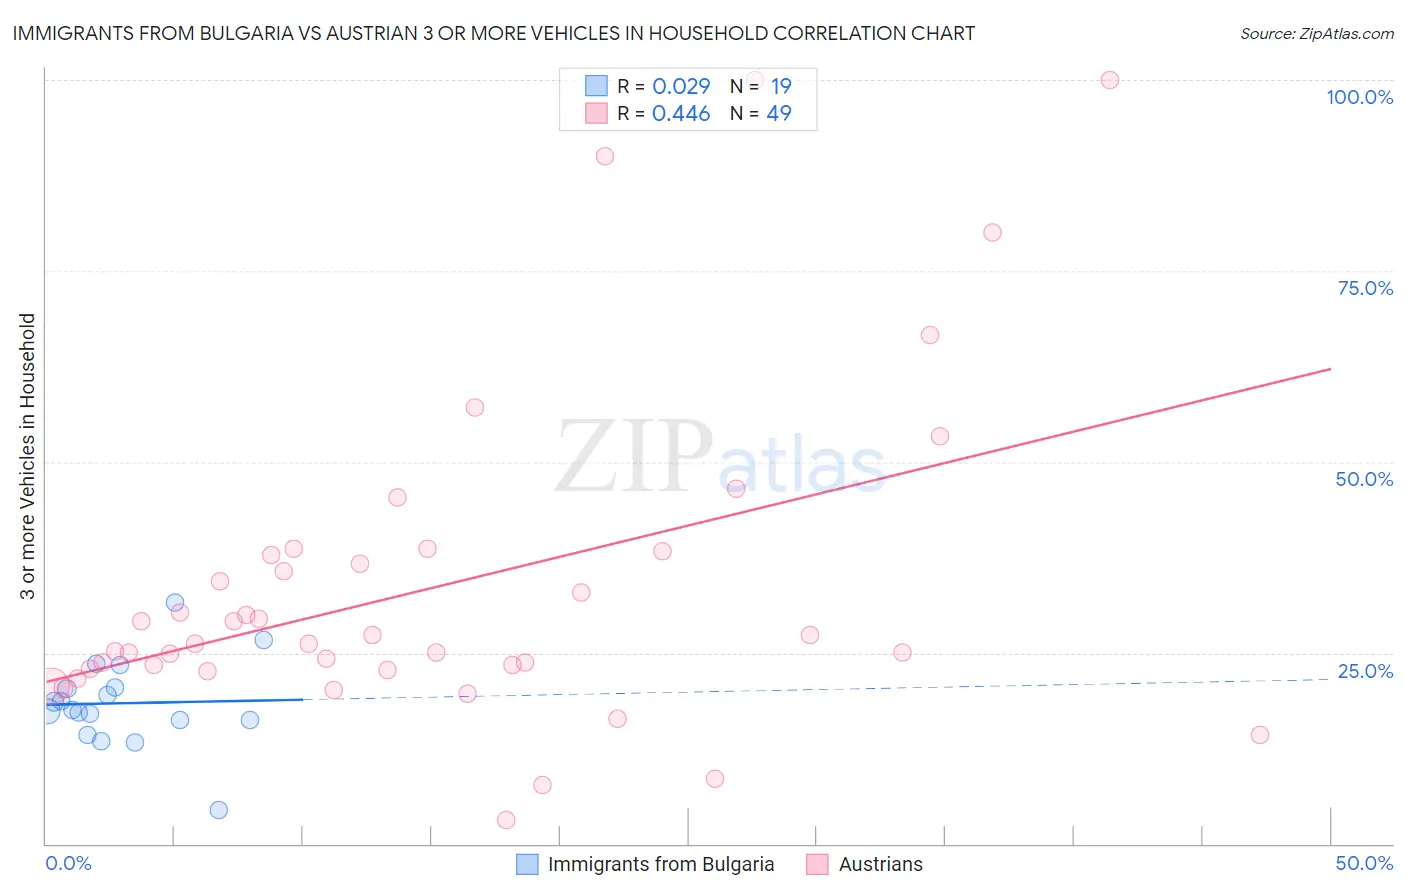
Immigrants from Bulgaria vs Austrian 3 or more Vehicles in Household Correlation Chart
The statistical analysis conducted on geographies consisting of 172,519,366 people shows no correlation between the proportion of Immigrants from Bulgaria and percentage of households with 3 or more vehicles available in the United States with a correlation coefficient (R) of 0.029 and weighted average of 17.7%. Similarly, the statistical analysis conducted on geographies consisting of 451,648,303 people shows a moderate positive correlation between the proportion of Austrians and percentage of households with 3 or more vehicles available in the United States with a correlation coefficient (R) of 0.446 and weighted average of 20.9%, a difference of 17.7%.
3 or more Vehicles in Household Correlation Summary
| Measurement | Immigrants from Bulgaria | Austrian |
| Minimum | 4.4% | 3.1% |
| Maximum | 31.6% | 100.0% |
| Range | 27.3% | 96.9% |
| Mean | 18.4% | 33.7% |
| Median | 17.6% | 26.2% |
| Interquartile 25% (IQ1) | 16.1% | 22.8% |
| Interquartile 75% (IQ3) | 20.5% | 38.0% |
| Interquartile Range (IQR) | 4.4% | 15.2% |
| Standard Deviation (Sample) | 5.7% | 21.3% |
| Standard Deviation (Population) | 5.5% | 21.1% |
Similar Demographics by 3 or more Vehicles in Household
Demographics Similar to Immigrants from Bulgaria by 3 or more Vehicles in Household
In terms of 3 or more vehicles in household, the demographic groups most similar to Immigrants from Bulgaria are Immigrants from Venezuela (17.7%, a difference of 0.010%), Macedonian (17.7%, a difference of 0.070%), Immigrants from Panama (17.7%, a difference of 0.090%), Cambodian (17.8%, a difference of 0.23%), and Bermudan (17.8%, a difference of 0.26%).
| Demographics | Rating | Rank | 3 or more Vehicles in Household |
| Immigrants | Northern Africa | 0.9 /100 | #261 | Tragic 17.8% |
| Colombians | 0.9 /100 | #262 | Tragic 17.8% |
| Bermudans | 0.9 /100 | #263 | Tragic 17.8% |
| Cambodians | 0.9 /100 | #264 | Tragic 17.8% |
| Immigrants | Panama | 0.8 /100 | #265 | Tragic 17.7% |
| Macedonians | 0.8 /100 | #266 | Tragic 17.7% |
| Immigrants | Venezuela | 0.8 /100 | #267 | Tragic 17.7% |
| Immigrants | Bulgaria | 0.8 /100 | #268 | Tragic 17.7% |
| Immigrants | France | 0.6 /100 | #269 | Tragic 17.6% |
| Immigrants | Nepal | 0.6 /100 | #270 | Tragic 17.6% |
| South Americans | 0.6 /100 | #271 | Tragic 17.6% |
| Immigrants | Africa | 0.5 /100 | #272 | Tragic 17.6% |
| Immigrants | Sudan | 0.5 /100 | #273 | Tragic 17.6% |
| Immigrants | Bosnia and Herzegovina | 0.5 /100 | #274 | Tragic 17.5% |
| Immigrants | Ukraine | 0.4 /100 | #275 | Tragic 17.5% |
Demographics Similar to Austrians by 3 or more Vehicles in Household
In terms of 3 or more vehicles in household, the demographic groups most similar to Austrians are Bolivian (20.8%, a difference of 0.090%), Luxembourger (20.9%, a difference of 0.10%), Immigrants from Germany (20.8%, a difference of 0.13%), Dutch West Indian (20.9%, a difference of 0.19%), and Seminole (20.9%, a difference of 0.23%).
| Demographics | Rating | Rank | 3 or more Vehicles in Household |
| Hmong | 98.2 /100 | #98 | Exceptional 21.0% |
| Alaska Natives | 98.2 /100 | #99 | Exceptional 21.0% |
| Comanche | 98.2 /100 | #100 | Exceptional 21.0% |
| Blackfeet | 97.9 /100 | #101 | Exceptional 20.9% |
| Seminole | 97.8 /100 | #102 | Exceptional 20.9% |
| Dutch West Indians | 97.8 /100 | #103 | Exceptional 20.9% |
| Luxembourgers | 97.7 /100 | #104 | Exceptional 20.9% |
| Austrians | 97.5 /100 | #105 | Exceptional 20.9% |
| Bolivians | 97.4 /100 | #106 | Exceptional 20.8% |
| Immigrants | Germany | 97.4 /100 | #107 | Exceptional 20.8% |
| Immigrants | Scotland | 97.1 /100 | #108 | Exceptional 20.8% |
| Filipinos | 97.0 /100 | #109 | Exceptional 20.8% |
| Asians | 96.8 /100 | #110 | Exceptional 20.8% |
| Immigrants | Micronesia | 96.7 /100 | #111 | Exceptional 20.7% |
| Nicaraguans | 96.2 /100 | #112 | Exceptional 20.7% |