Immigrants from Bulgaria vs Immigrants from Eastern Africa 3 or more Vehicles in Household
COMPARE
Immigrants from Bulgaria
Immigrants from Eastern Africa
3 or more Vehicles in Household
3 or more Vehicles in Household Comparison
Immigrants from Bulgaria
Immigrants from Eastern Africa
17.7%
3 OR MORE VEHICLES IN HOUSEHOLD
0.8/ 100
METRIC RATING
268th/ 347
METRIC RANK
18.0%
3 OR MORE VEHICLES IN HOUSEHOLD
1.8/ 100
METRIC RATING
248th/ 347
METRIC RANK
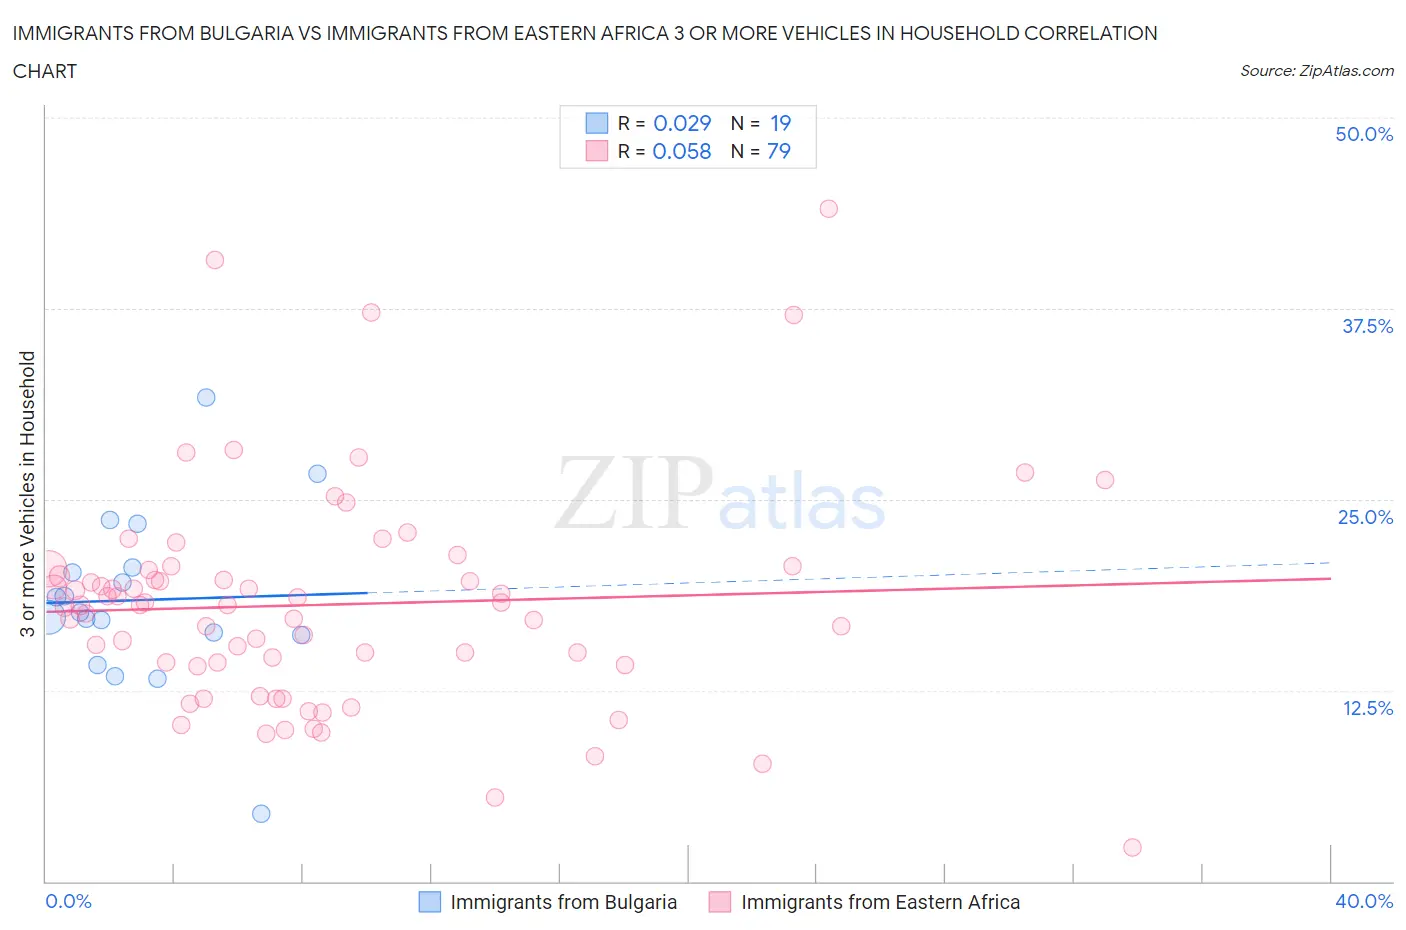
Immigrants from Bulgaria vs Immigrants from Eastern Africa 3 or more Vehicles in Household Correlation Chart
The statistical analysis conducted on geographies consisting of 172,519,366 people shows no correlation between the proportion of Immigrants from Bulgaria and percentage of households with 3 or more vehicles available in the United States with a correlation coefficient (R) of 0.029 and weighted average of 17.7%. Similarly, the statistical analysis conducted on geographies consisting of 354,834,893 people shows a slight positive correlation between the proportion of Immigrants from Eastern Africa and percentage of households with 3 or more vehicles available in the United States with a correlation coefficient (R) of 0.058 and weighted average of 18.0%, a difference of 1.7%.
3 or more Vehicles in Household Correlation Summary
| Measurement | Immigrants from Bulgaria | Immigrants from Eastern Africa |
| Minimum | 4.4% | 2.2% |
| Maximum | 31.6% | 44.0% |
| Range | 27.3% | 41.8% |
| Mean | 18.4% | 18.1% |
| Median | 17.6% | 18.1% |
| Interquartile 25% (IQ1) | 16.1% | 14.1% |
| Interquartile 75% (IQ3) | 20.5% | 20.4% |
| Interquartile Range (IQR) | 4.4% | 6.3% |
| Standard Deviation (Sample) | 5.7% | 7.2% |
| Standard Deviation (Population) | 5.5% | 7.2% |
Demographics Similar to Immigrants from Bulgaria and Immigrants from Eastern Africa by 3 or more Vehicles in Household
In terms of 3 or more vehicles in household, the demographic groups most similar to Immigrants from Bulgaria are Immigrants from Venezuela (17.7%, a difference of 0.010%), Macedonian (17.7%, a difference of 0.070%), Immigrants from Panama (17.7%, a difference of 0.090%), Cambodian (17.8%, a difference of 0.23%), and Bermudan (17.8%, a difference of 0.26%). Similarly, the demographic groups most similar to Immigrants from Eastern Africa are Immigrants from Saudi Arabia (18.0%, a difference of 0.060%), Venezuelan (18.0%, a difference of 0.080%), Alsatian (18.0%, a difference of 0.28%), Immigrants from Southern Europe (17.9%, a difference of 0.50%), and Immigrants from Ethiopia (17.9%, a difference of 0.72%).
| Demographics | Rating | Rank | 3 or more Vehicles in Household |
| Immigrants | Eastern Africa | 1.8 /100 | #248 | Tragic 18.0% |
| Immigrants | Saudi Arabia | 1.7 /100 | #249 | Tragic 18.0% |
| Venezuelans | 1.7 /100 | #250 | Tragic 18.0% |
| Alsatians | 1.5 /100 | #251 | Tragic 18.0% |
| Immigrants | Southern Europe | 1.4 /100 | #252 | Tragic 17.9% |
| Immigrants | Ethiopia | 1.3 /100 | #253 | Tragic 17.9% |
| Ethiopians | 1.2 /100 | #254 | Tragic 17.9% |
| Immigrants | Turkey | 1.2 /100 | #255 | Tragic 17.9% |
| Sub-Saharan Africans | 1.1 /100 | #256 | Tragic 17.9% |
| Immigrants | Eritrea | 1.1 /100 | #257 | Tragic 17.8% |
| Sudanese | 1.1 /100 | #258 | Tragic 17.8% |
| Uruguayans | 1.0 /100 | #259 | Tragic 17.8% |
| Ugandans | 0.9 /100 | #260 | Tragic 17.8% |
| Immigrants | Northern Africa | 0.9 /100 | #261 | Tragic 17.8% |
| Colombians | 0.9 /100 | #262 | Tragic 17.8% |
| Bermudans | 0.9 /100 | #263 | Tragic 17.8% |
| Cambodians | 0.9 /100 | #264 | Tragic 17.8% |
| Immigrants | Panama | 0.8 /100 | #265 | Tragic 17.7% |
| Macedonians | 0.8 /100 | #266 | Tragic 17.7% |
| Immigrants | Venezuela | 0.8 /100 | #267 | Tragic 17.7% |
| Immigrants | Bulgaria | 0.8 /100 | #268 | Tragic 17.7% |