Immigrants from Bulgaria vs French Canadian 3 or more Vehicles in Household
COMPARE
Immigrants from Bulgaria
French Canadian
3 or more Vehicles in Household
3 or more Vehicles in Household Comparison
Immigrants from Bulgaria
French Canadians
17.7%
3 OR MORE VEHICLES IN HOUSEHOLD
0.8/ 100
METRIC RATING
268th/ 347
METRIC RANK
20.6%
3 OR MORE VEHICLES IN HOUSEHOLD
95.0/ 100
METRIC RATING
115th/ 347
METRIC RANK
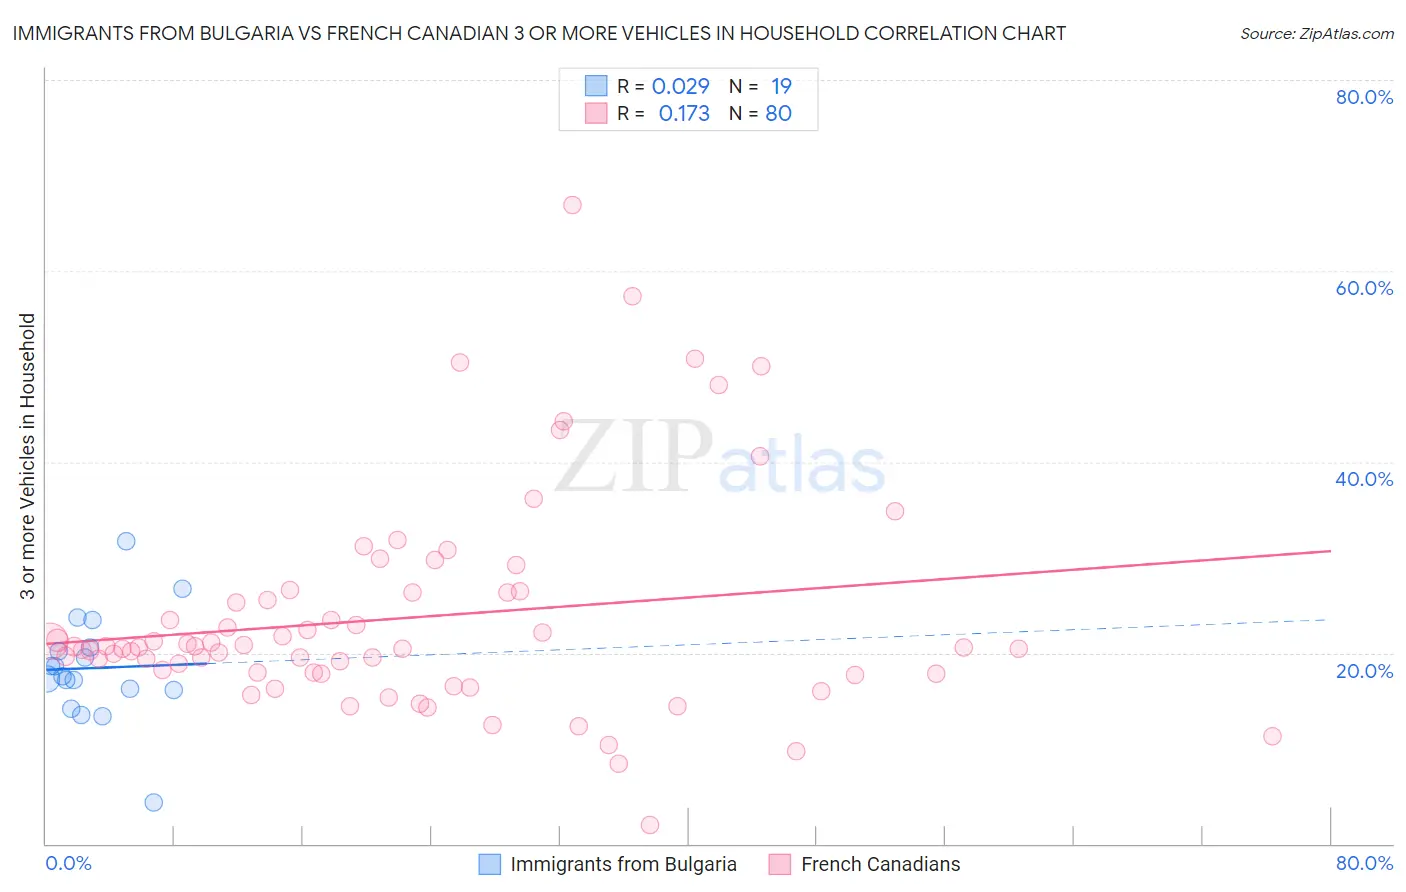
Immigrants from Bulgaria vs French Canadian 3 or more Vehicles in Household Correlation Chart
The statistical analysis conducted on geographies consisting of 172,519,366 people shows no correlation between the proportion of Immigrants from Bulgaria and percentage of households with 3 or more vehicles available in the United States with a correlation coefficient (R) of 0.029 and weighted average of 17.7%. Similarly, the statistical analysis conducted on geographies consisting of 502,103,809 people shows a poor positive correlation between the proportion of French Canadians and percentage of households with 3 or more vehicles available in the United States with a correlation coefficient (R) of 0.173 and weighted average of 20.6%, a difference of 16.2%.
3 or more Vehicles in Household Correlation Summary
| Measurement | Immigrants from Bulgaria | French Canadian |
| Minimum | 4.4% | 2.0% |
| Maximum | 31.6% | 66.8% |
| Range | 27.3% | 64.8% |
| Mean | 18.4% | 23.7% |
| Median | 17.6% | 20.6% |
| Interquartile 25% (IQ1) | 16.1% | 17.9% |
| Interquartile 75% (IQ3) | 20.5% | 26.4% |
| Interquartile Range (IQR) | 4.4% | 8.5% |
| Standard Deviation (Sample) | 5.7% | 11.3% |
| Standard Deviation (Population) | 5.5% | 11.3% |
Similar Demographics by 3 or more Vehicles in Household
Demographics Similar to Immigrants from Bulgaria by 3 or more Vehicles in Household
In terms of 3 or more vehicles in household, the demographic groups most similar to Immigrants from Bulgaria are Immigrants from Venezuela (17.7%, a difference of 0.010%), Macedonian (17.7%, a difference of 0.070%), Immigrants from Panama (17.7%, a difference of 0.090%), Cambodian (17.8%, a difference of 0.23%), and Bermudan (17.8%, a difference of 0.26%).
| Demographics | Rating | Rank | 3 or more Vehicles in Household |
| Immigrants | Northern Africa | 0.9 /100 | #261 | Tragic 17.8% |
| Colombians | 0.9 /100 | #262 | Tragic 17.8% |
| Bermudans | 0.9 /100 | #263 | Tragic 17.8% |
| Cambodians | 0.9 /100 | #264 | Tragic 17.8% |
| Immigrants | Panama | 0.8 /100 | #265 | Tragic 17.7% |
| Macedonians | 0.8 /100 | #266 | Tragic 17.7% |
| Immigrants | Venezuela | 0.8 /100 | #267 | Tragic 17.7% |
| Immigrants | Bulgaria | 0.8 /100 | #268 | Tragic 17.7% |
| Immigrants | France | 0.6 /100 | #269 | Tragic 17.6% |
| Immigrants | Nepal | 0.6 /100 | #270 | Tragic 17.6% |
| South Americans | 0.6 /100 | #271 | Tragic 17.6% |
| Immigrants | Africa | 0.5 /100 | #272 | Tragic 17.6% |
| Immigrants | Sudan | 0.5 /100 | #273 | Tragic 17.6% |
| Immigrants | Bosnia and Herzegovina | 0.5 /100 | #274 | Tragic 17.5% |
| Immigrants | Ukraine | 0.4 /100 | #275 | Tragic 17.5% |
Demographics Similar to French Canadians by 3 or more Vehicles in Household
In terms of 3 or more vehicles in household, the demographic groups most similar to French Canadians are Italian (20.6%, a difference of 0.030%), Croatian (20.6%, a difference of 0.050%), Costa Rican (20.6%, a difference of 0.16%), Immigrants from Latin America (20.5%, a difference of 0.20%), and Burmese (20.6%, a difference of 0.31%).
| Demographics | Rating | Rank | 3 or more Vehicles in Household |
| Immigrants | Scotland | 97.1 /100 | #108 | Exceptional 20.8% |
| Filipinos | 97.0 /100 | #109 | Exceptional 20.8% |
| Asians | 96.8 /100 | #110 | Exceptional 20.8% |
| Immigrants | Micronesia | 96.7 /100 | #111 | Exceptional 20.7% |
| Nicaraguans | 96.2 /100 | #112 | Exceptional 20.7% |
| Immigrants | England | 96.2 /100 | #113 | Exceptional 20.7% |
| Burmese | 95.8 /100 | #114 | Exceptional 20.6% |
| French Canadians | 95.0 /100 | #115 | Exceptional 20.6% |
| Italians | 94.9 /100 | #116 | Exceptional 20.6% |
| Croatians | 94.9 /100 | #117 | Exceptional 20.6% |
| Costa Ricans | 94.6 /100 | #118 | Exceptional 20.6% |
| Immigrants | Latin America | 94.5 /100 | #119 | Exceptional 20.5% |
| Maltese | 93.9 /100 | #120 | Exceptional 20.5% |
| Immigrants | Thailand | 93.8 /100 | #121 | Exceptional 20.5% |
| German Russians | 93.7 /100 | #122 | Exceptional 20.5% |